Health and Care Experience Survey, Variations in Experience 2021/22
All results by type of care experience
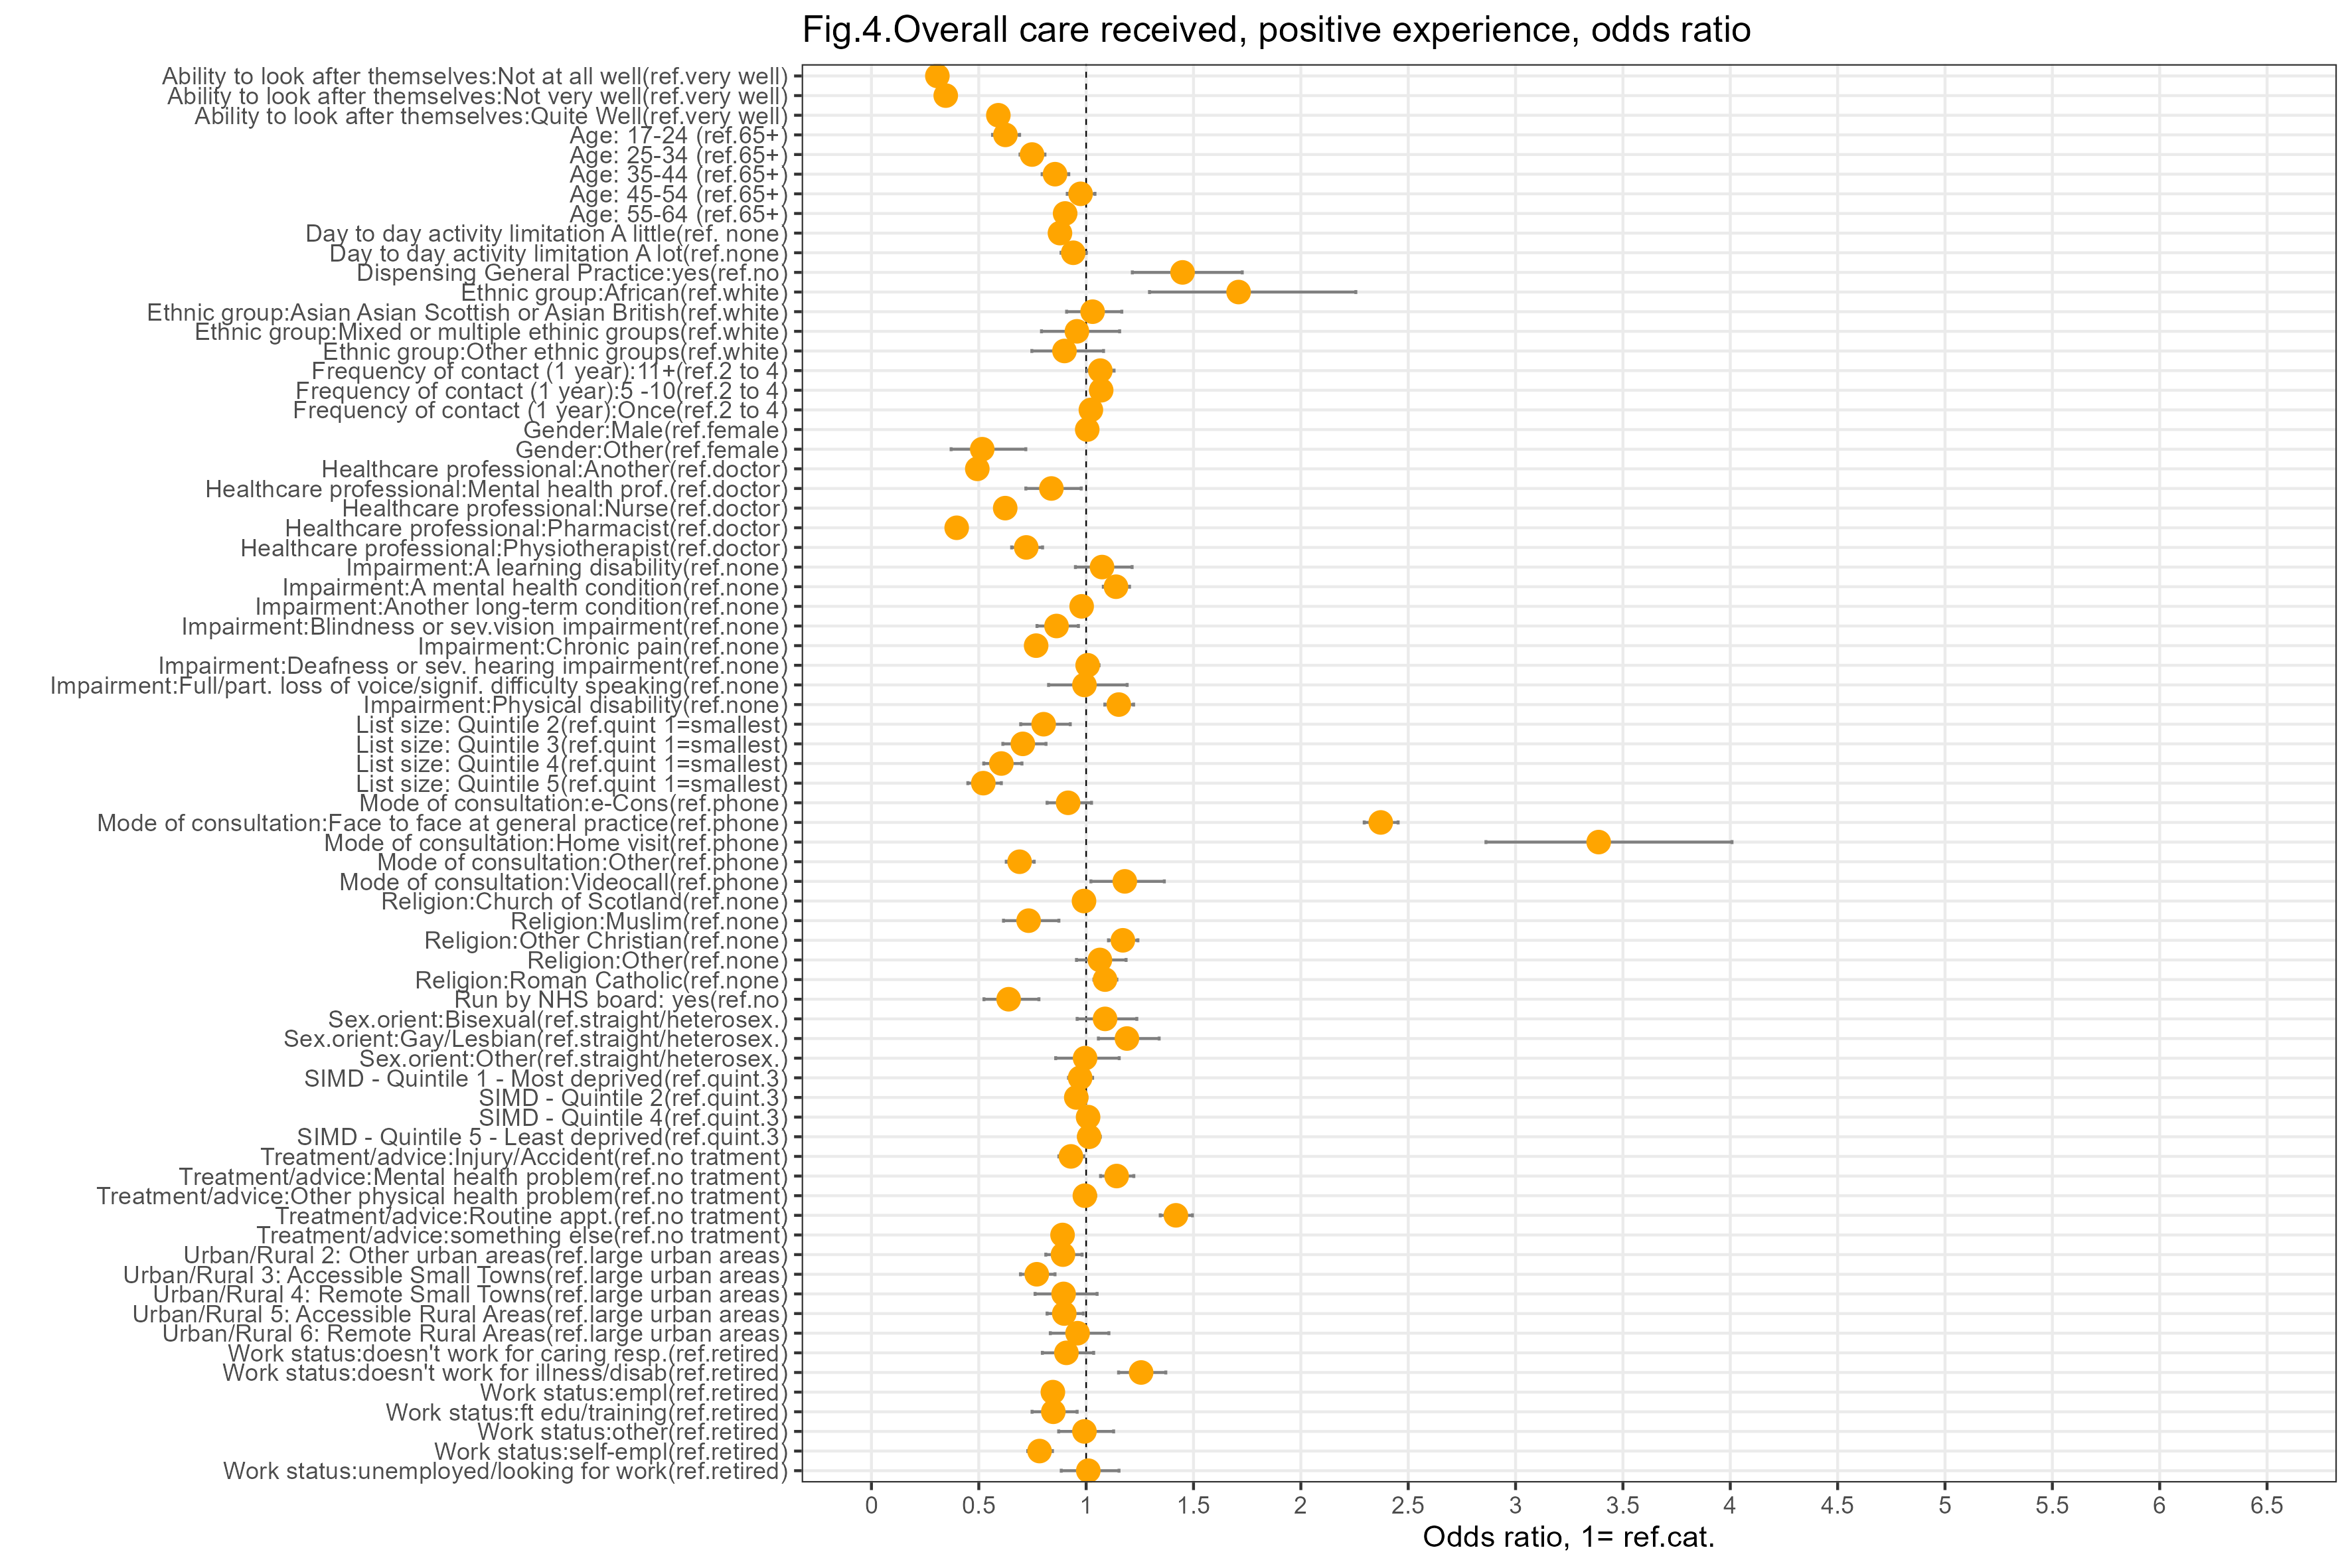
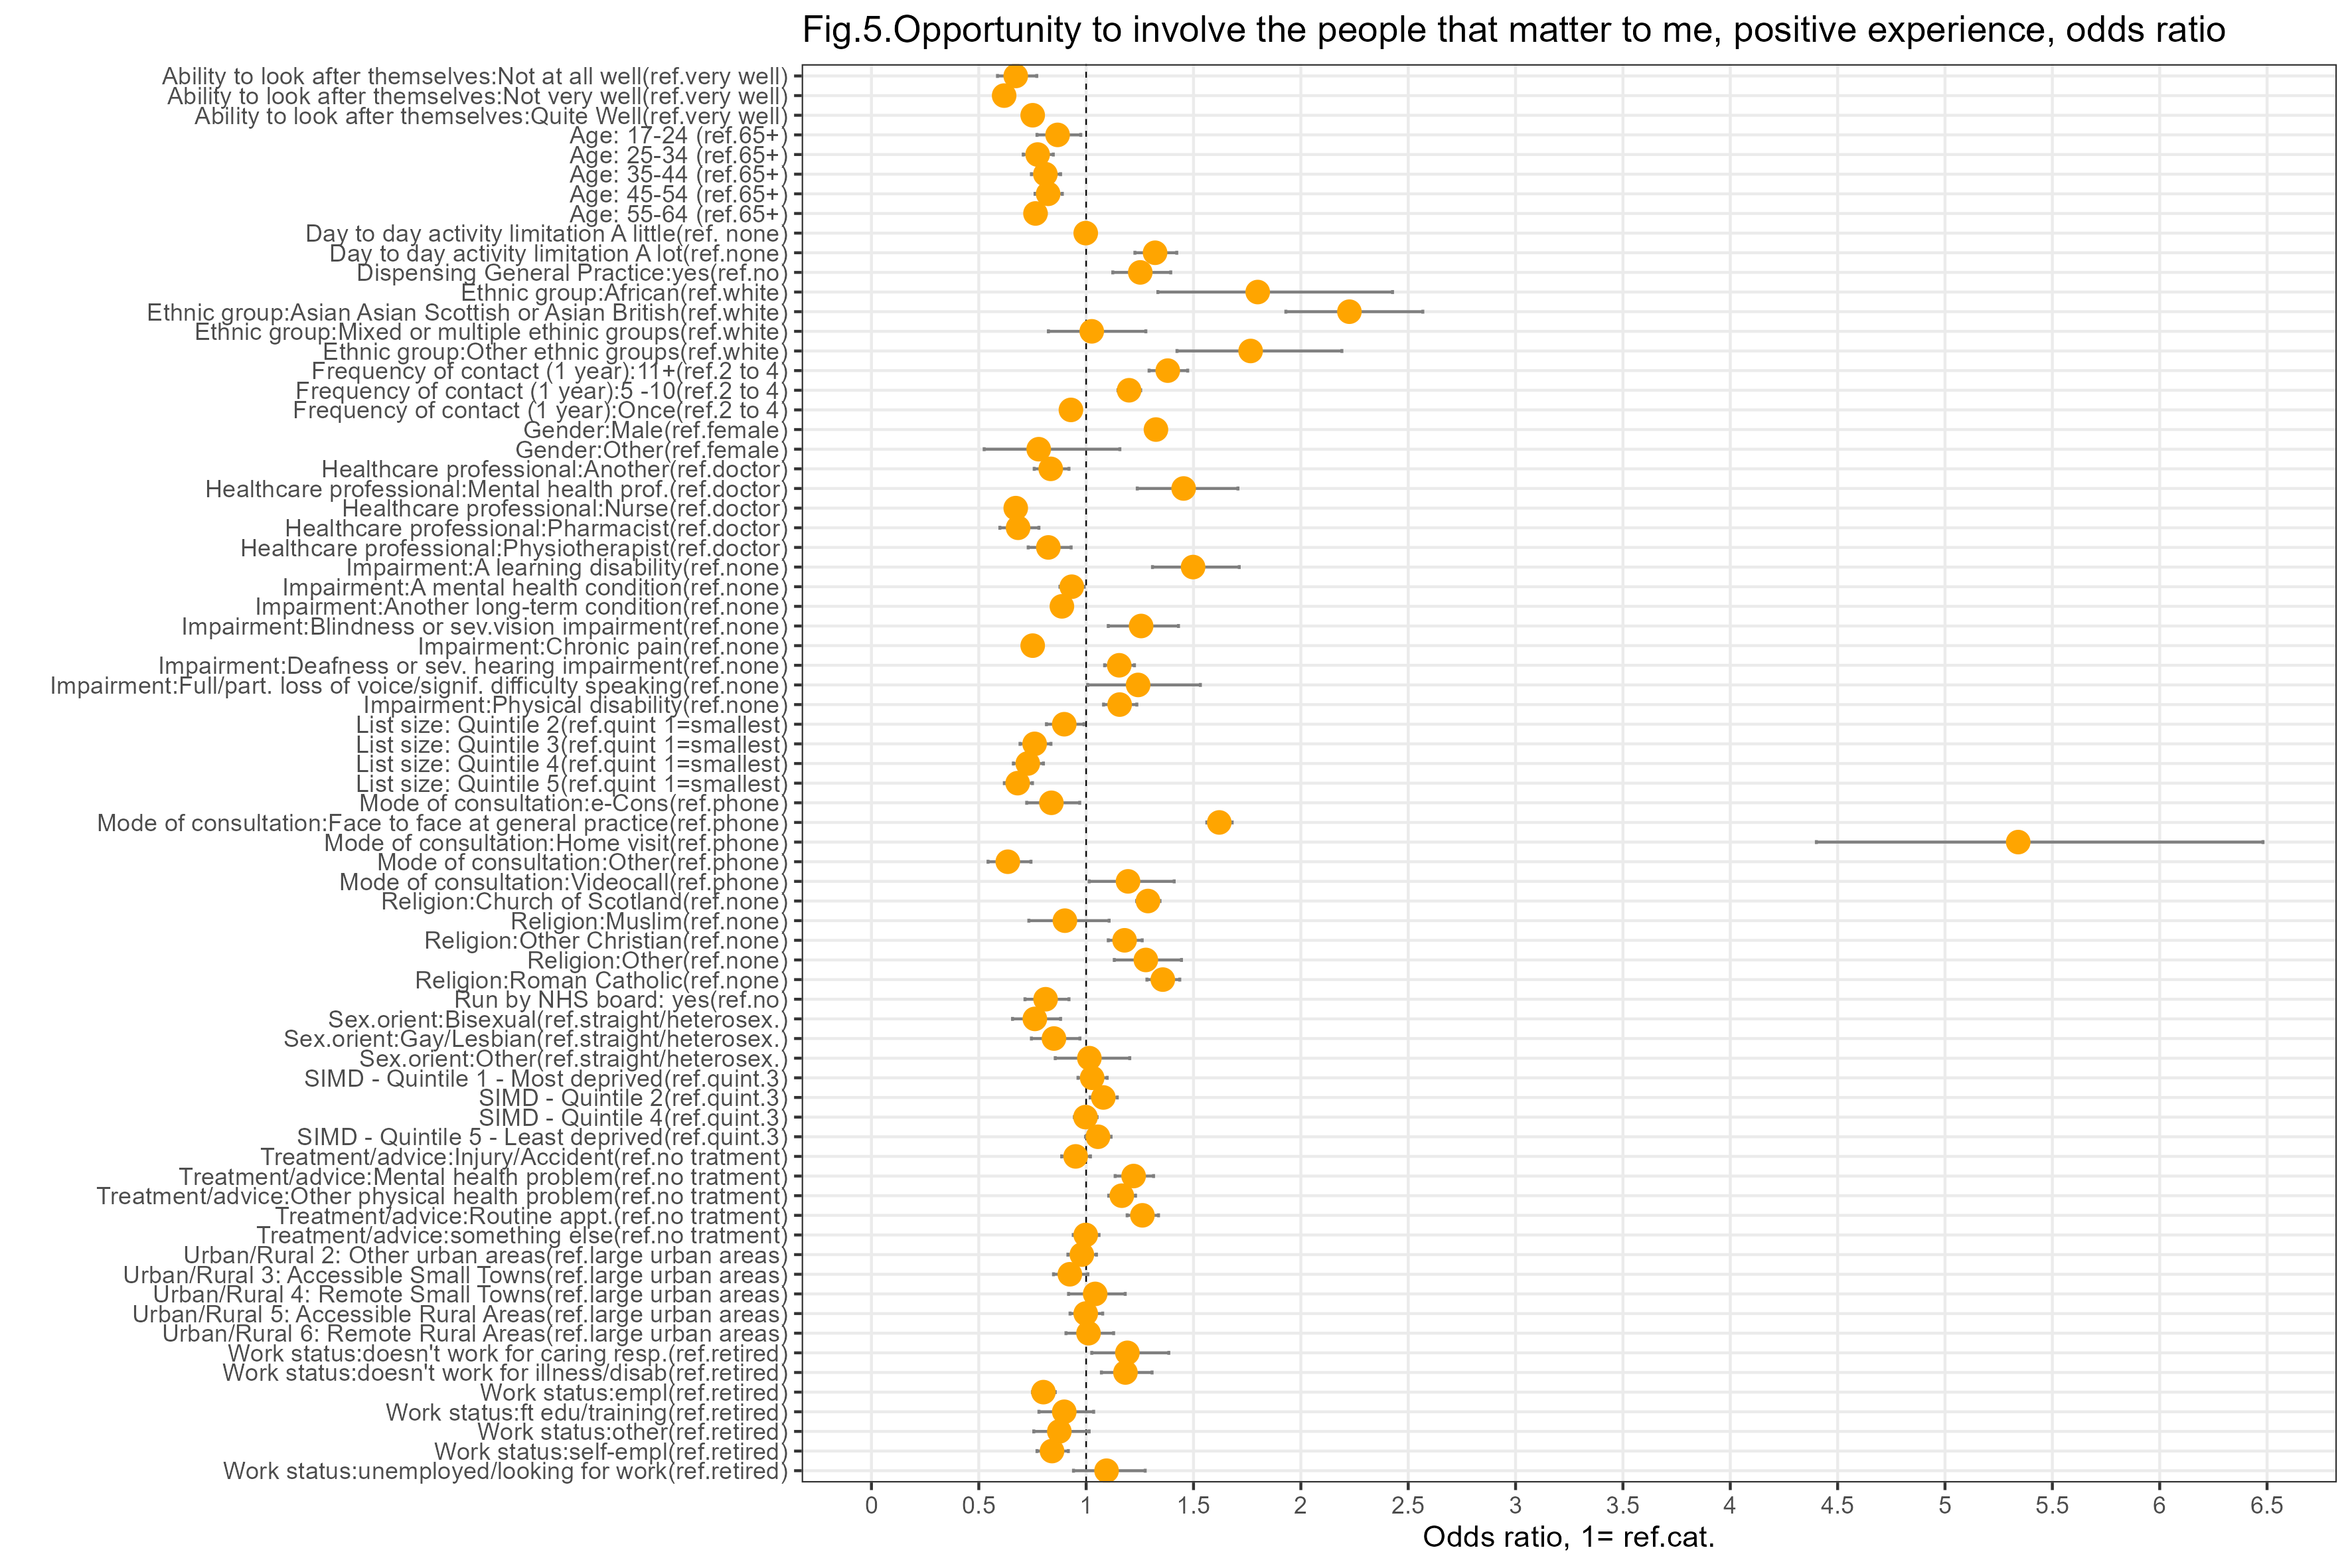
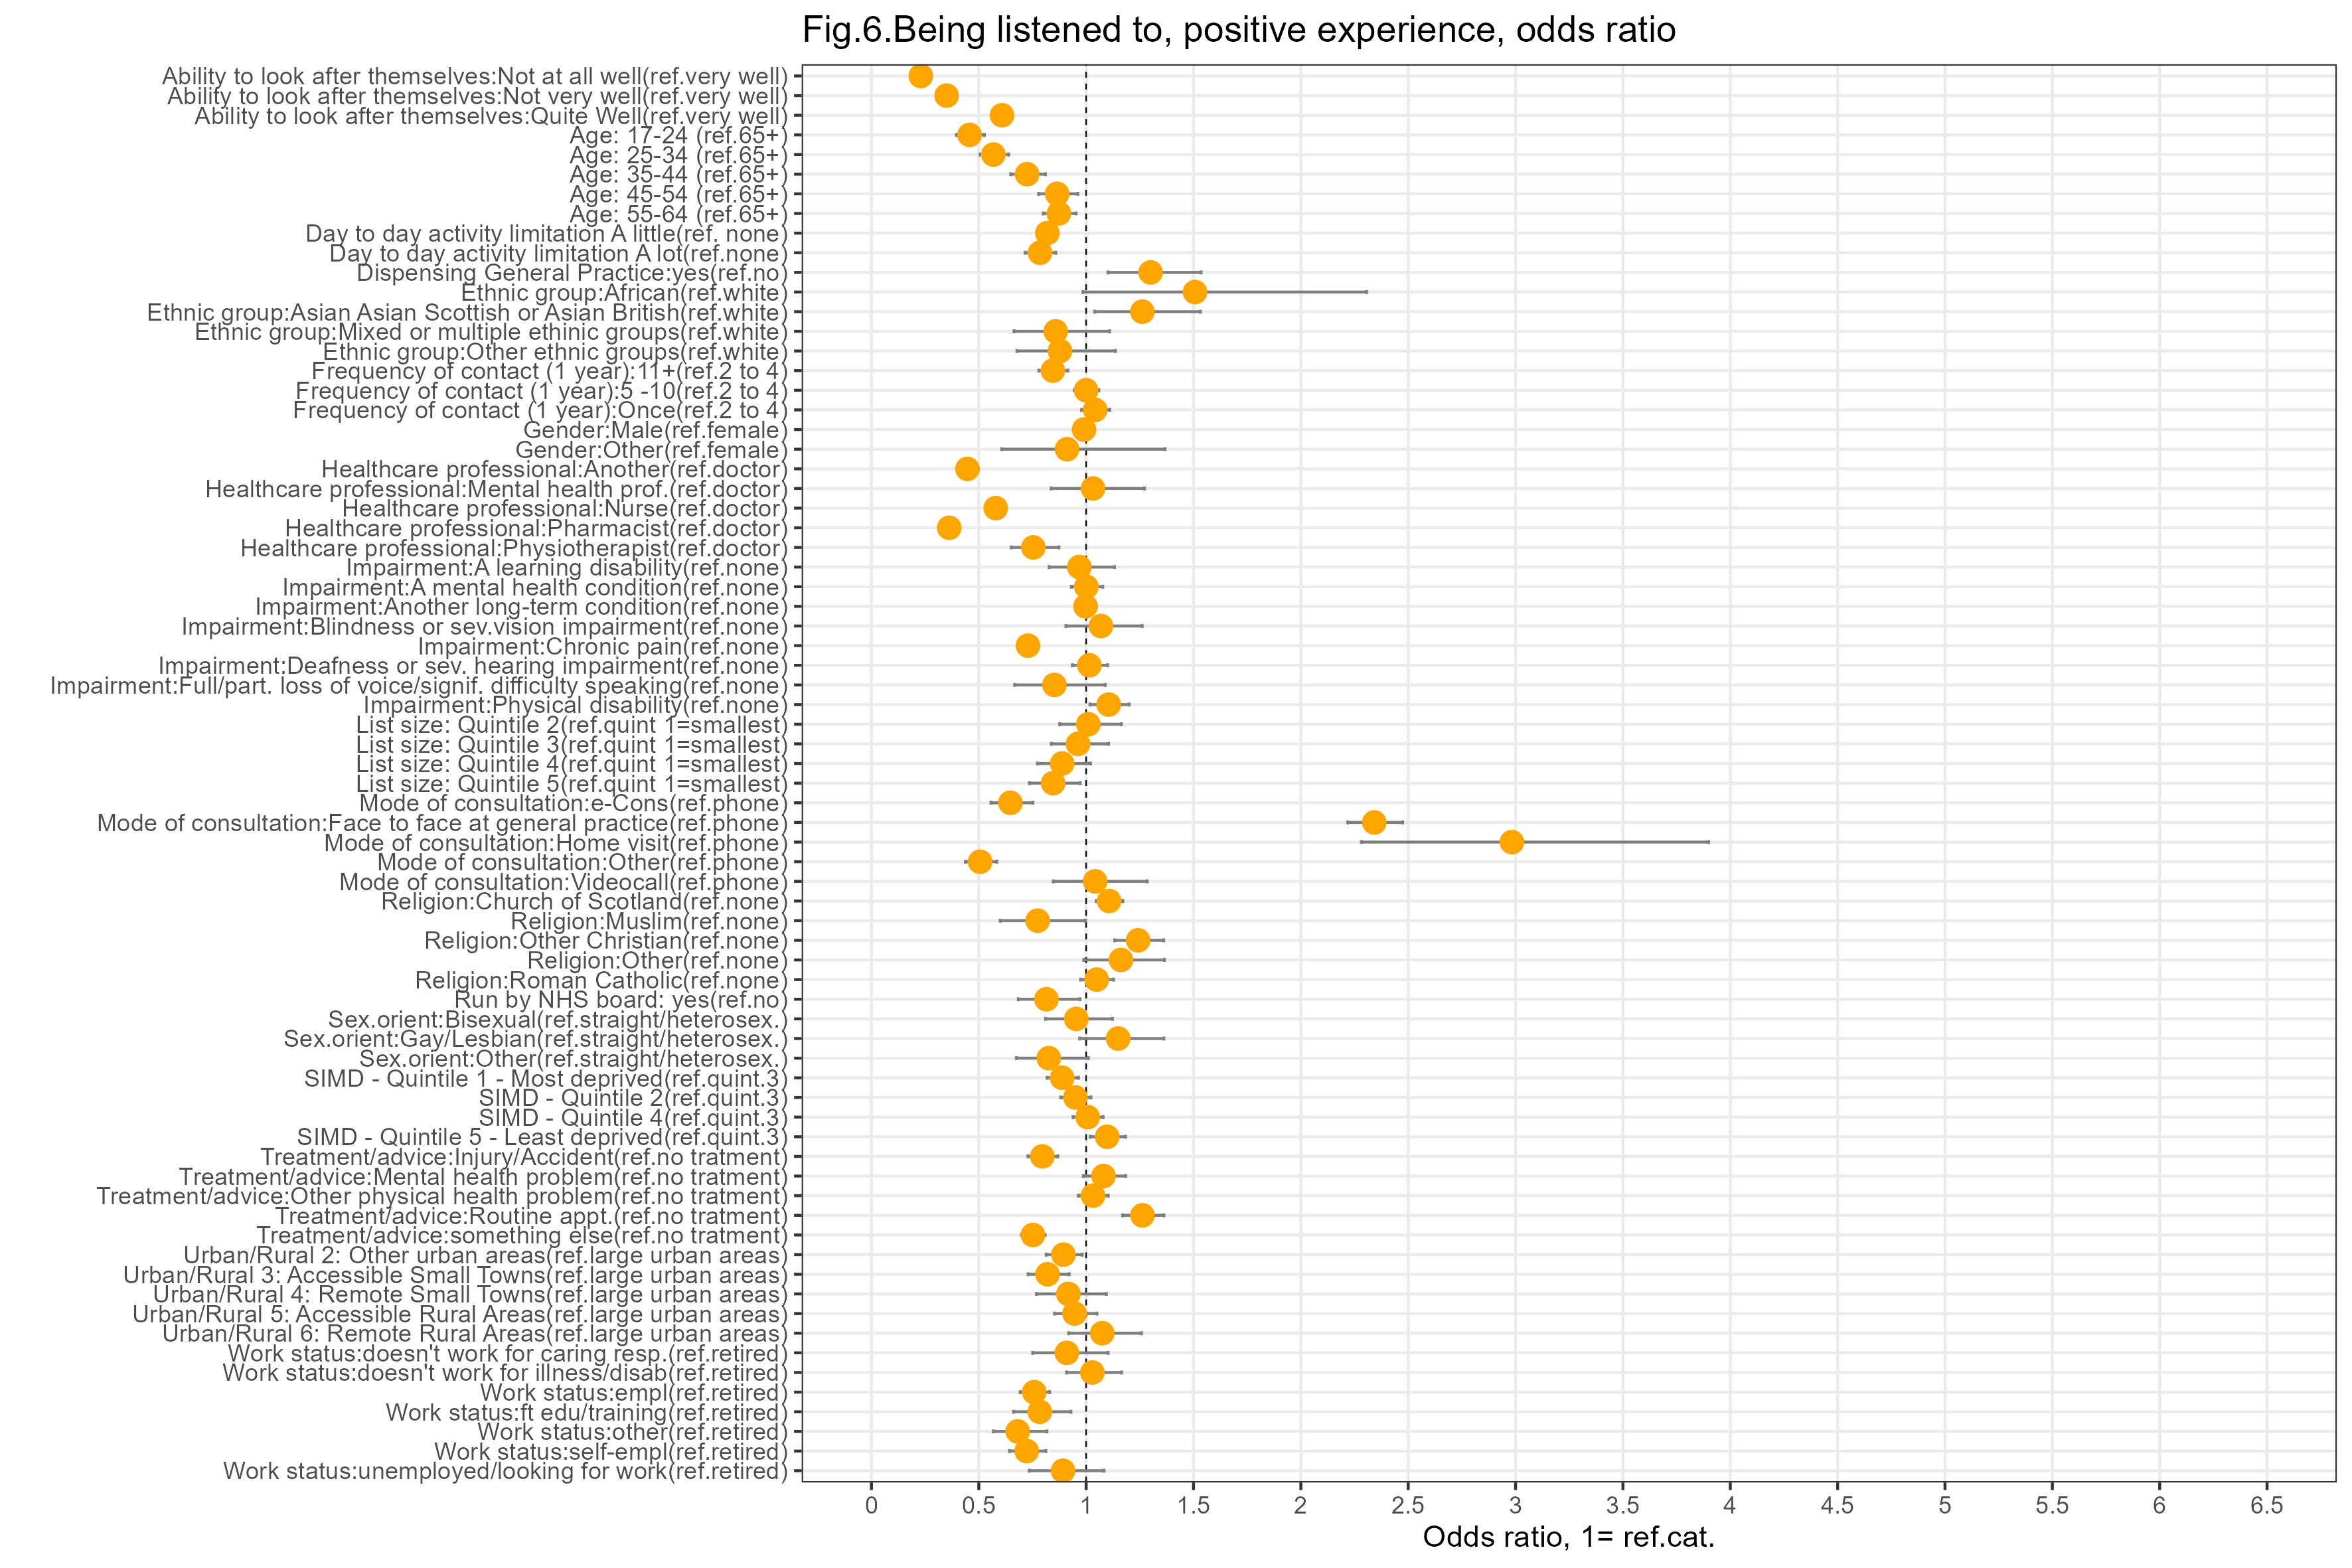
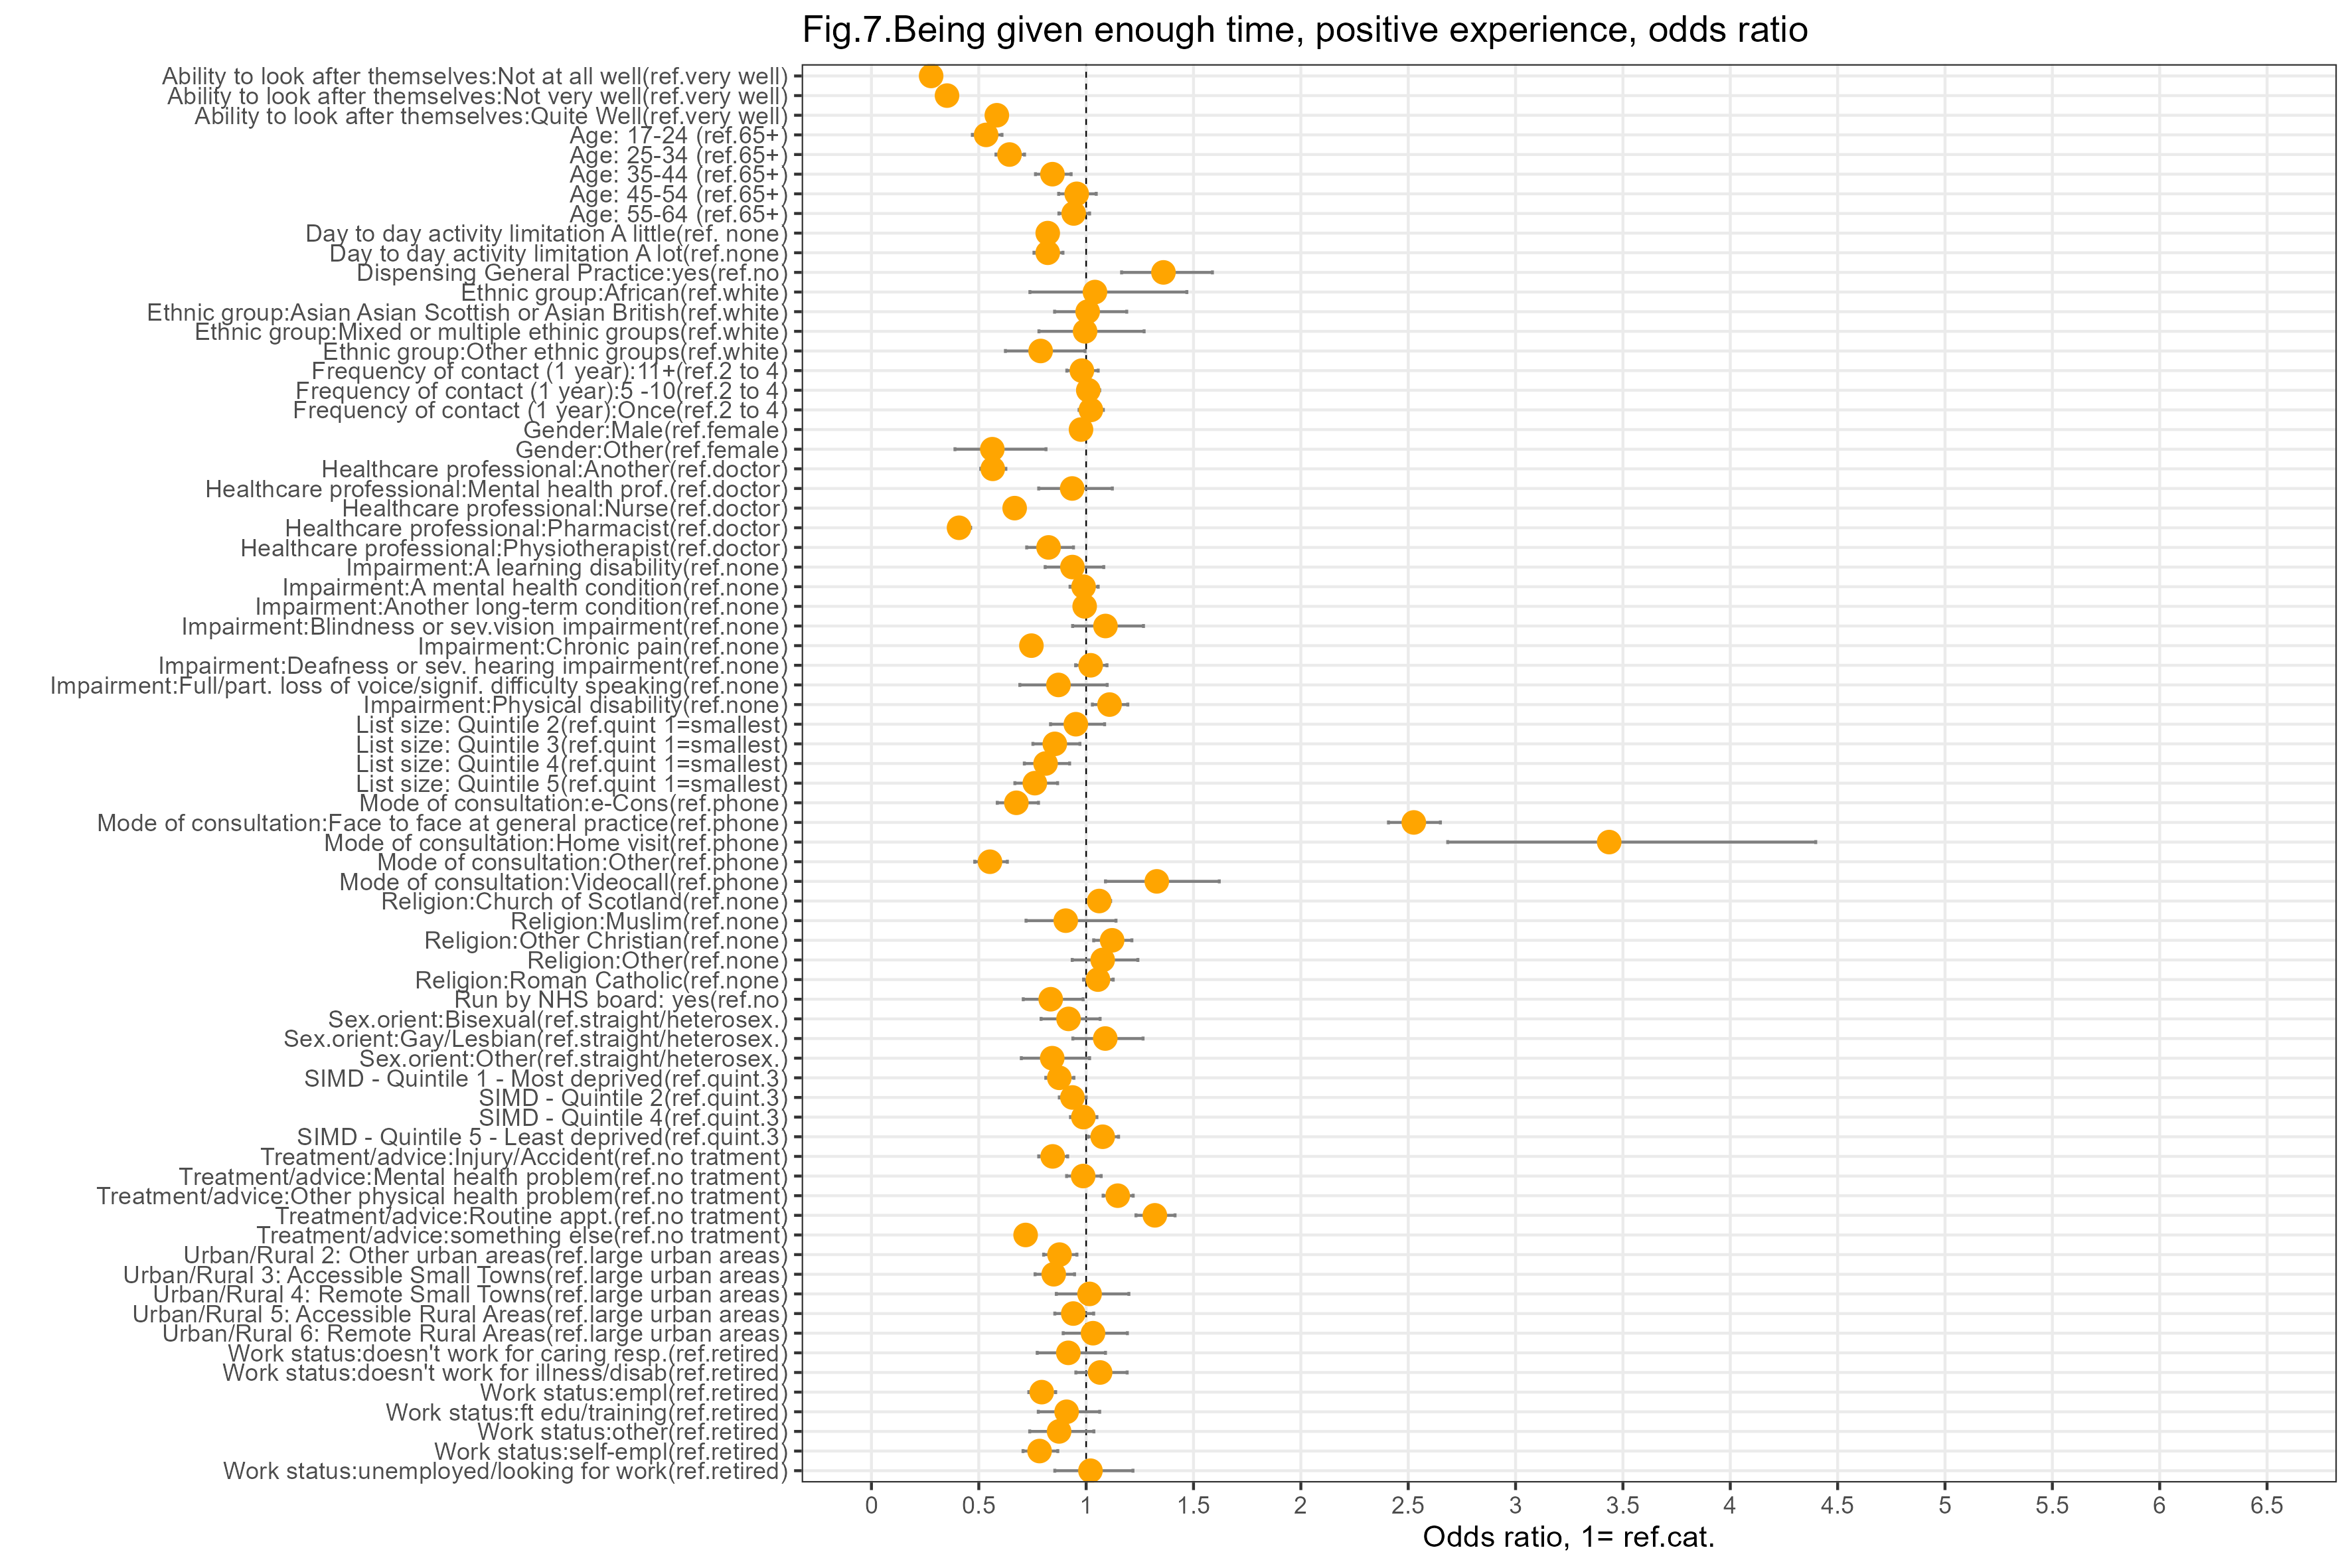
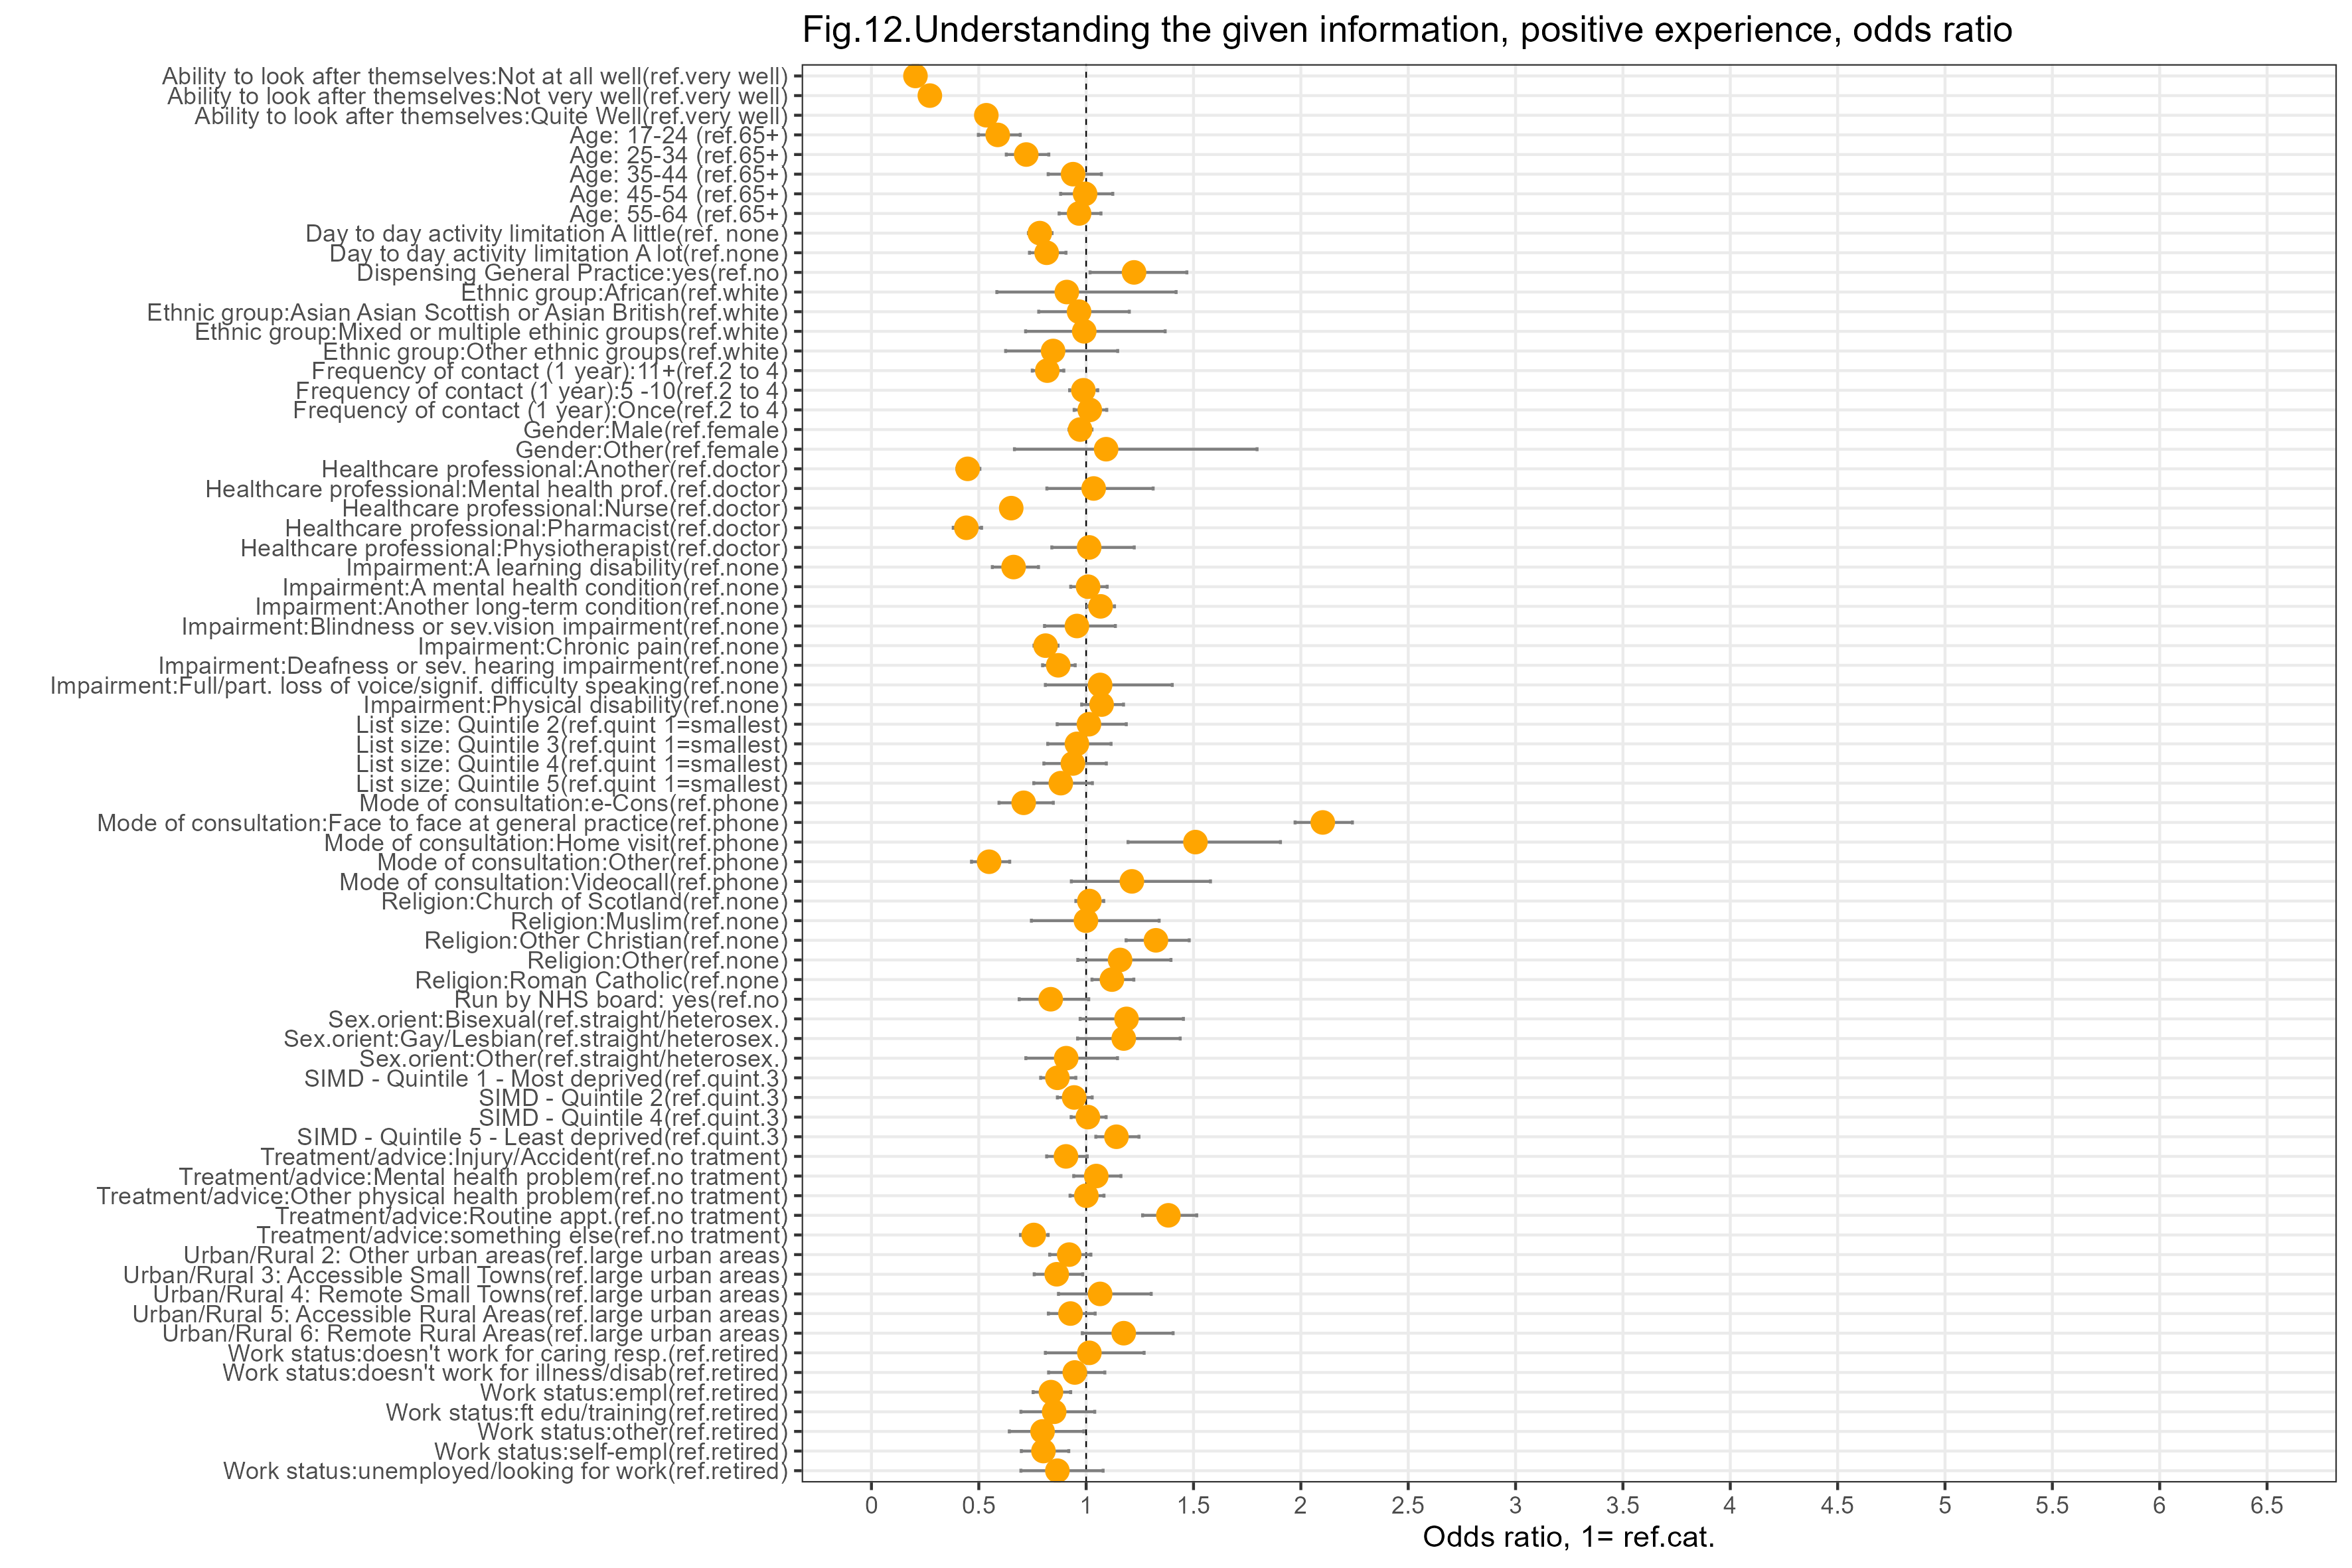
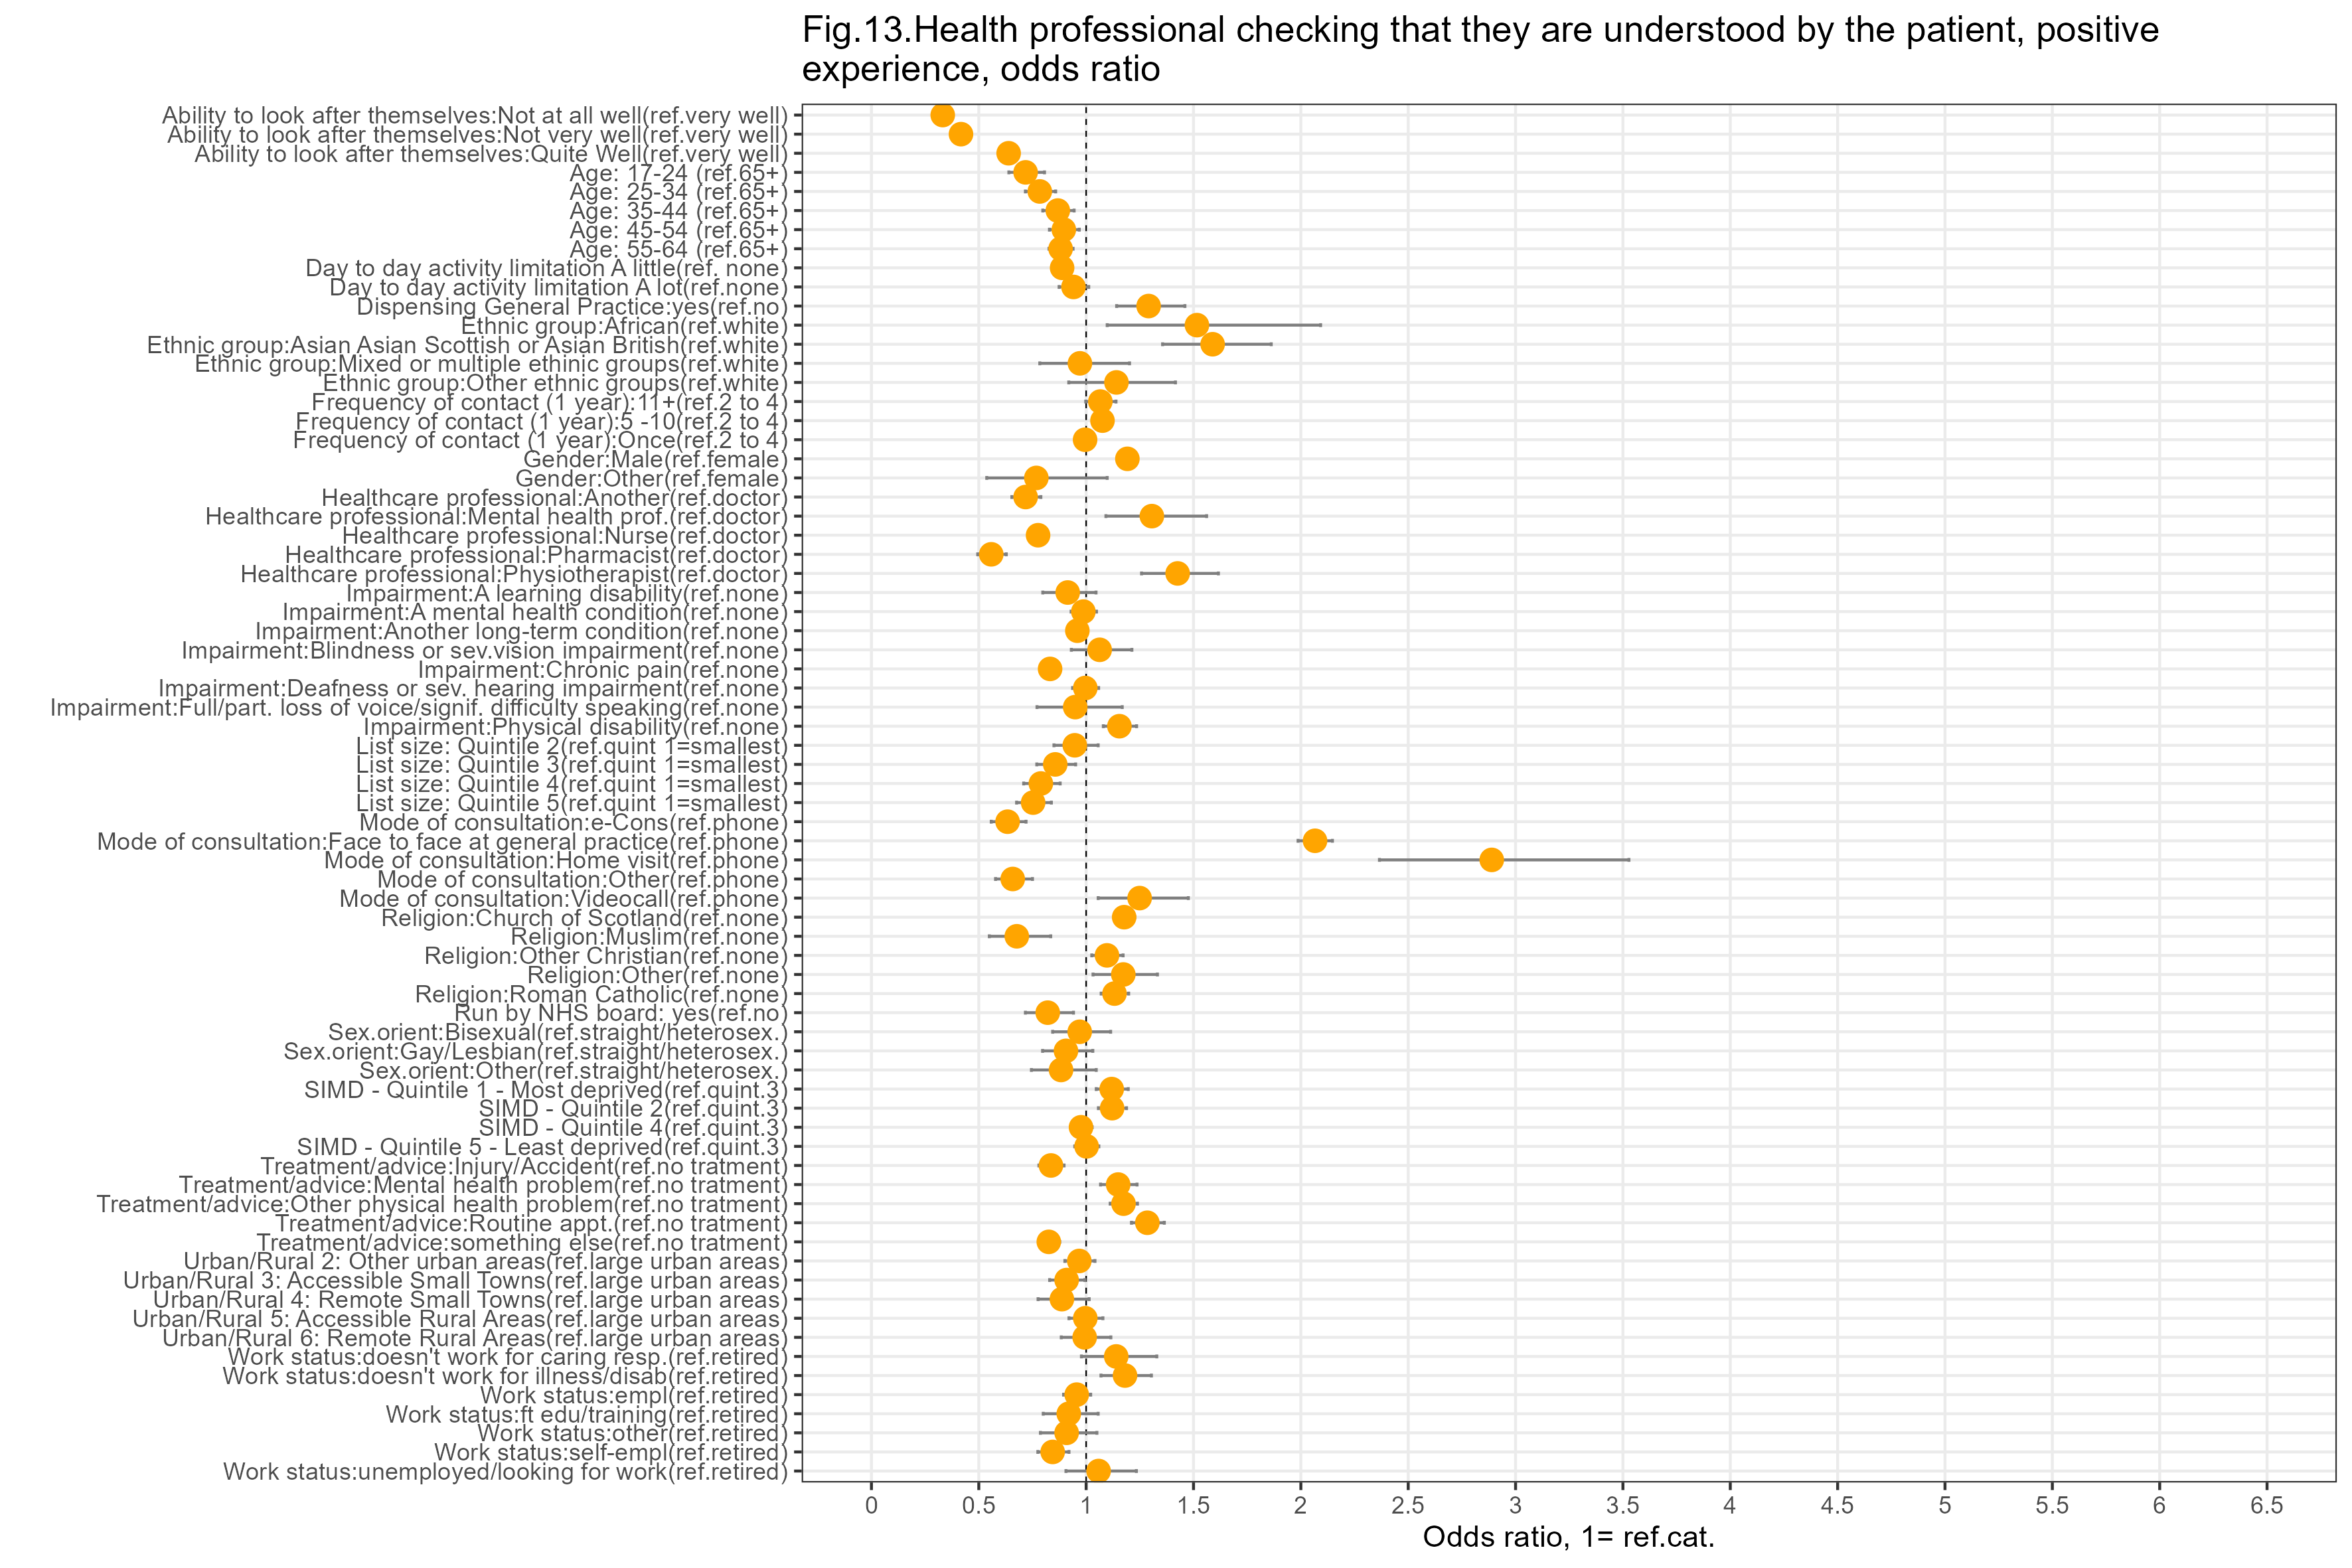
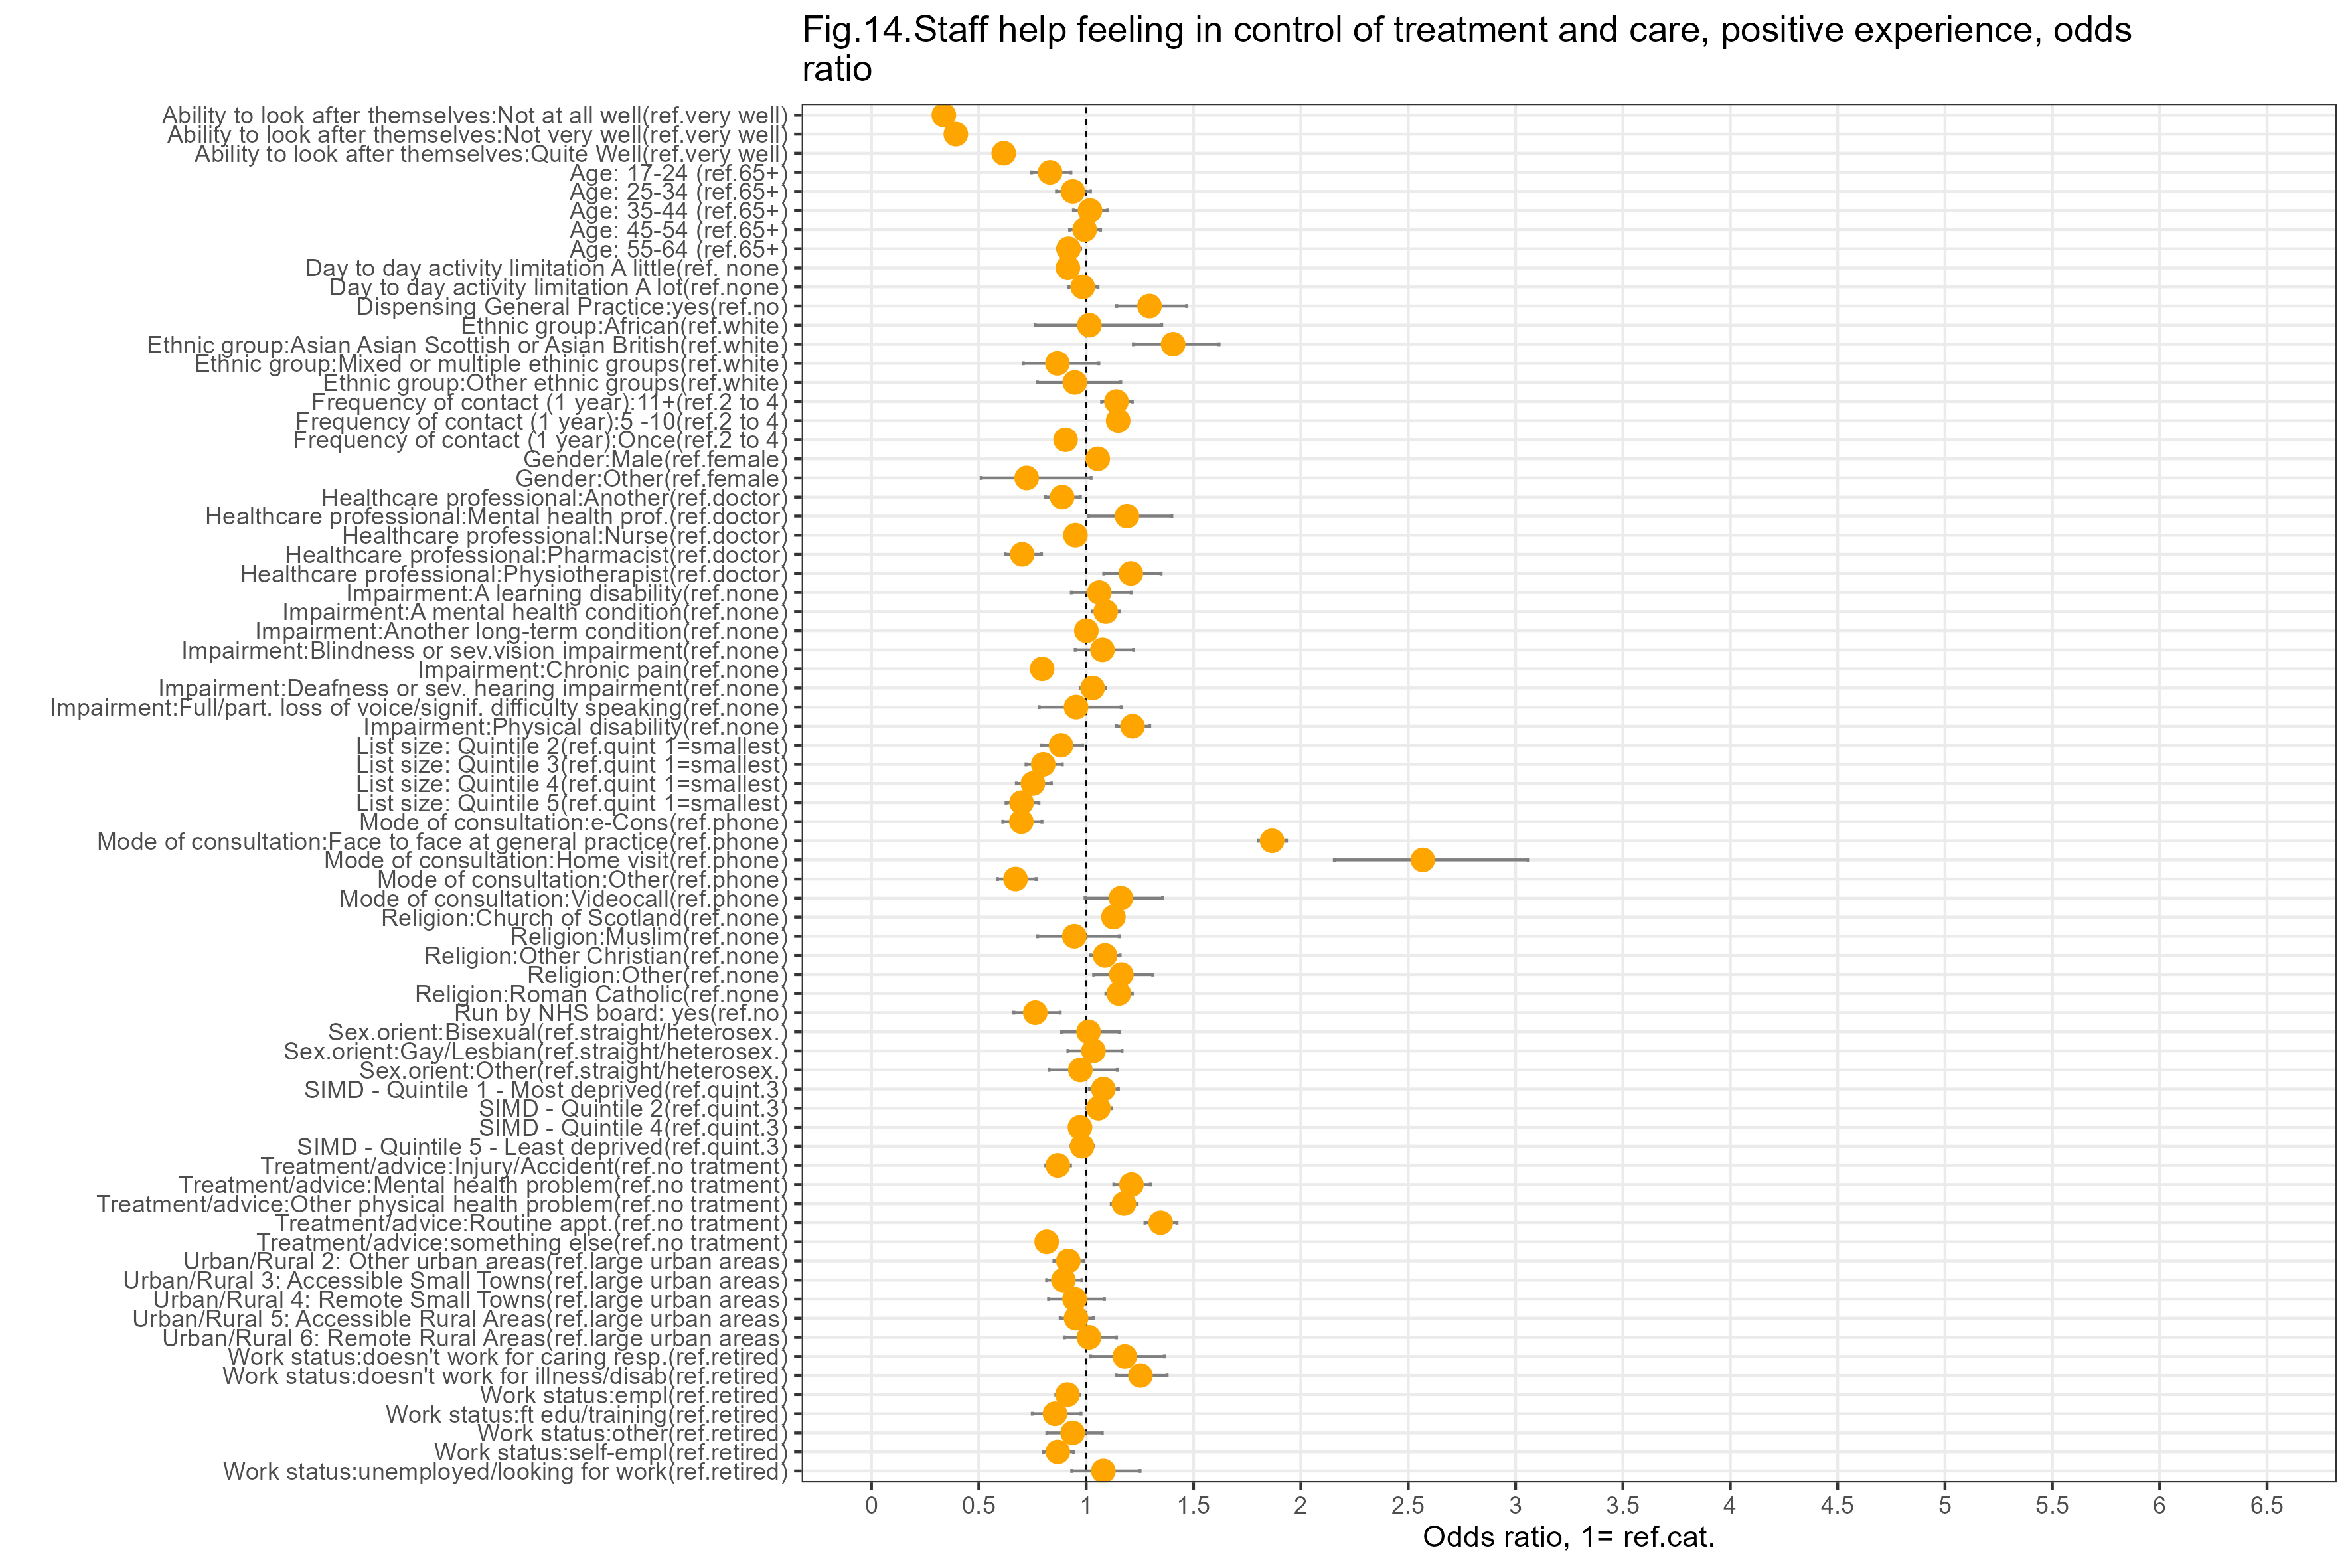
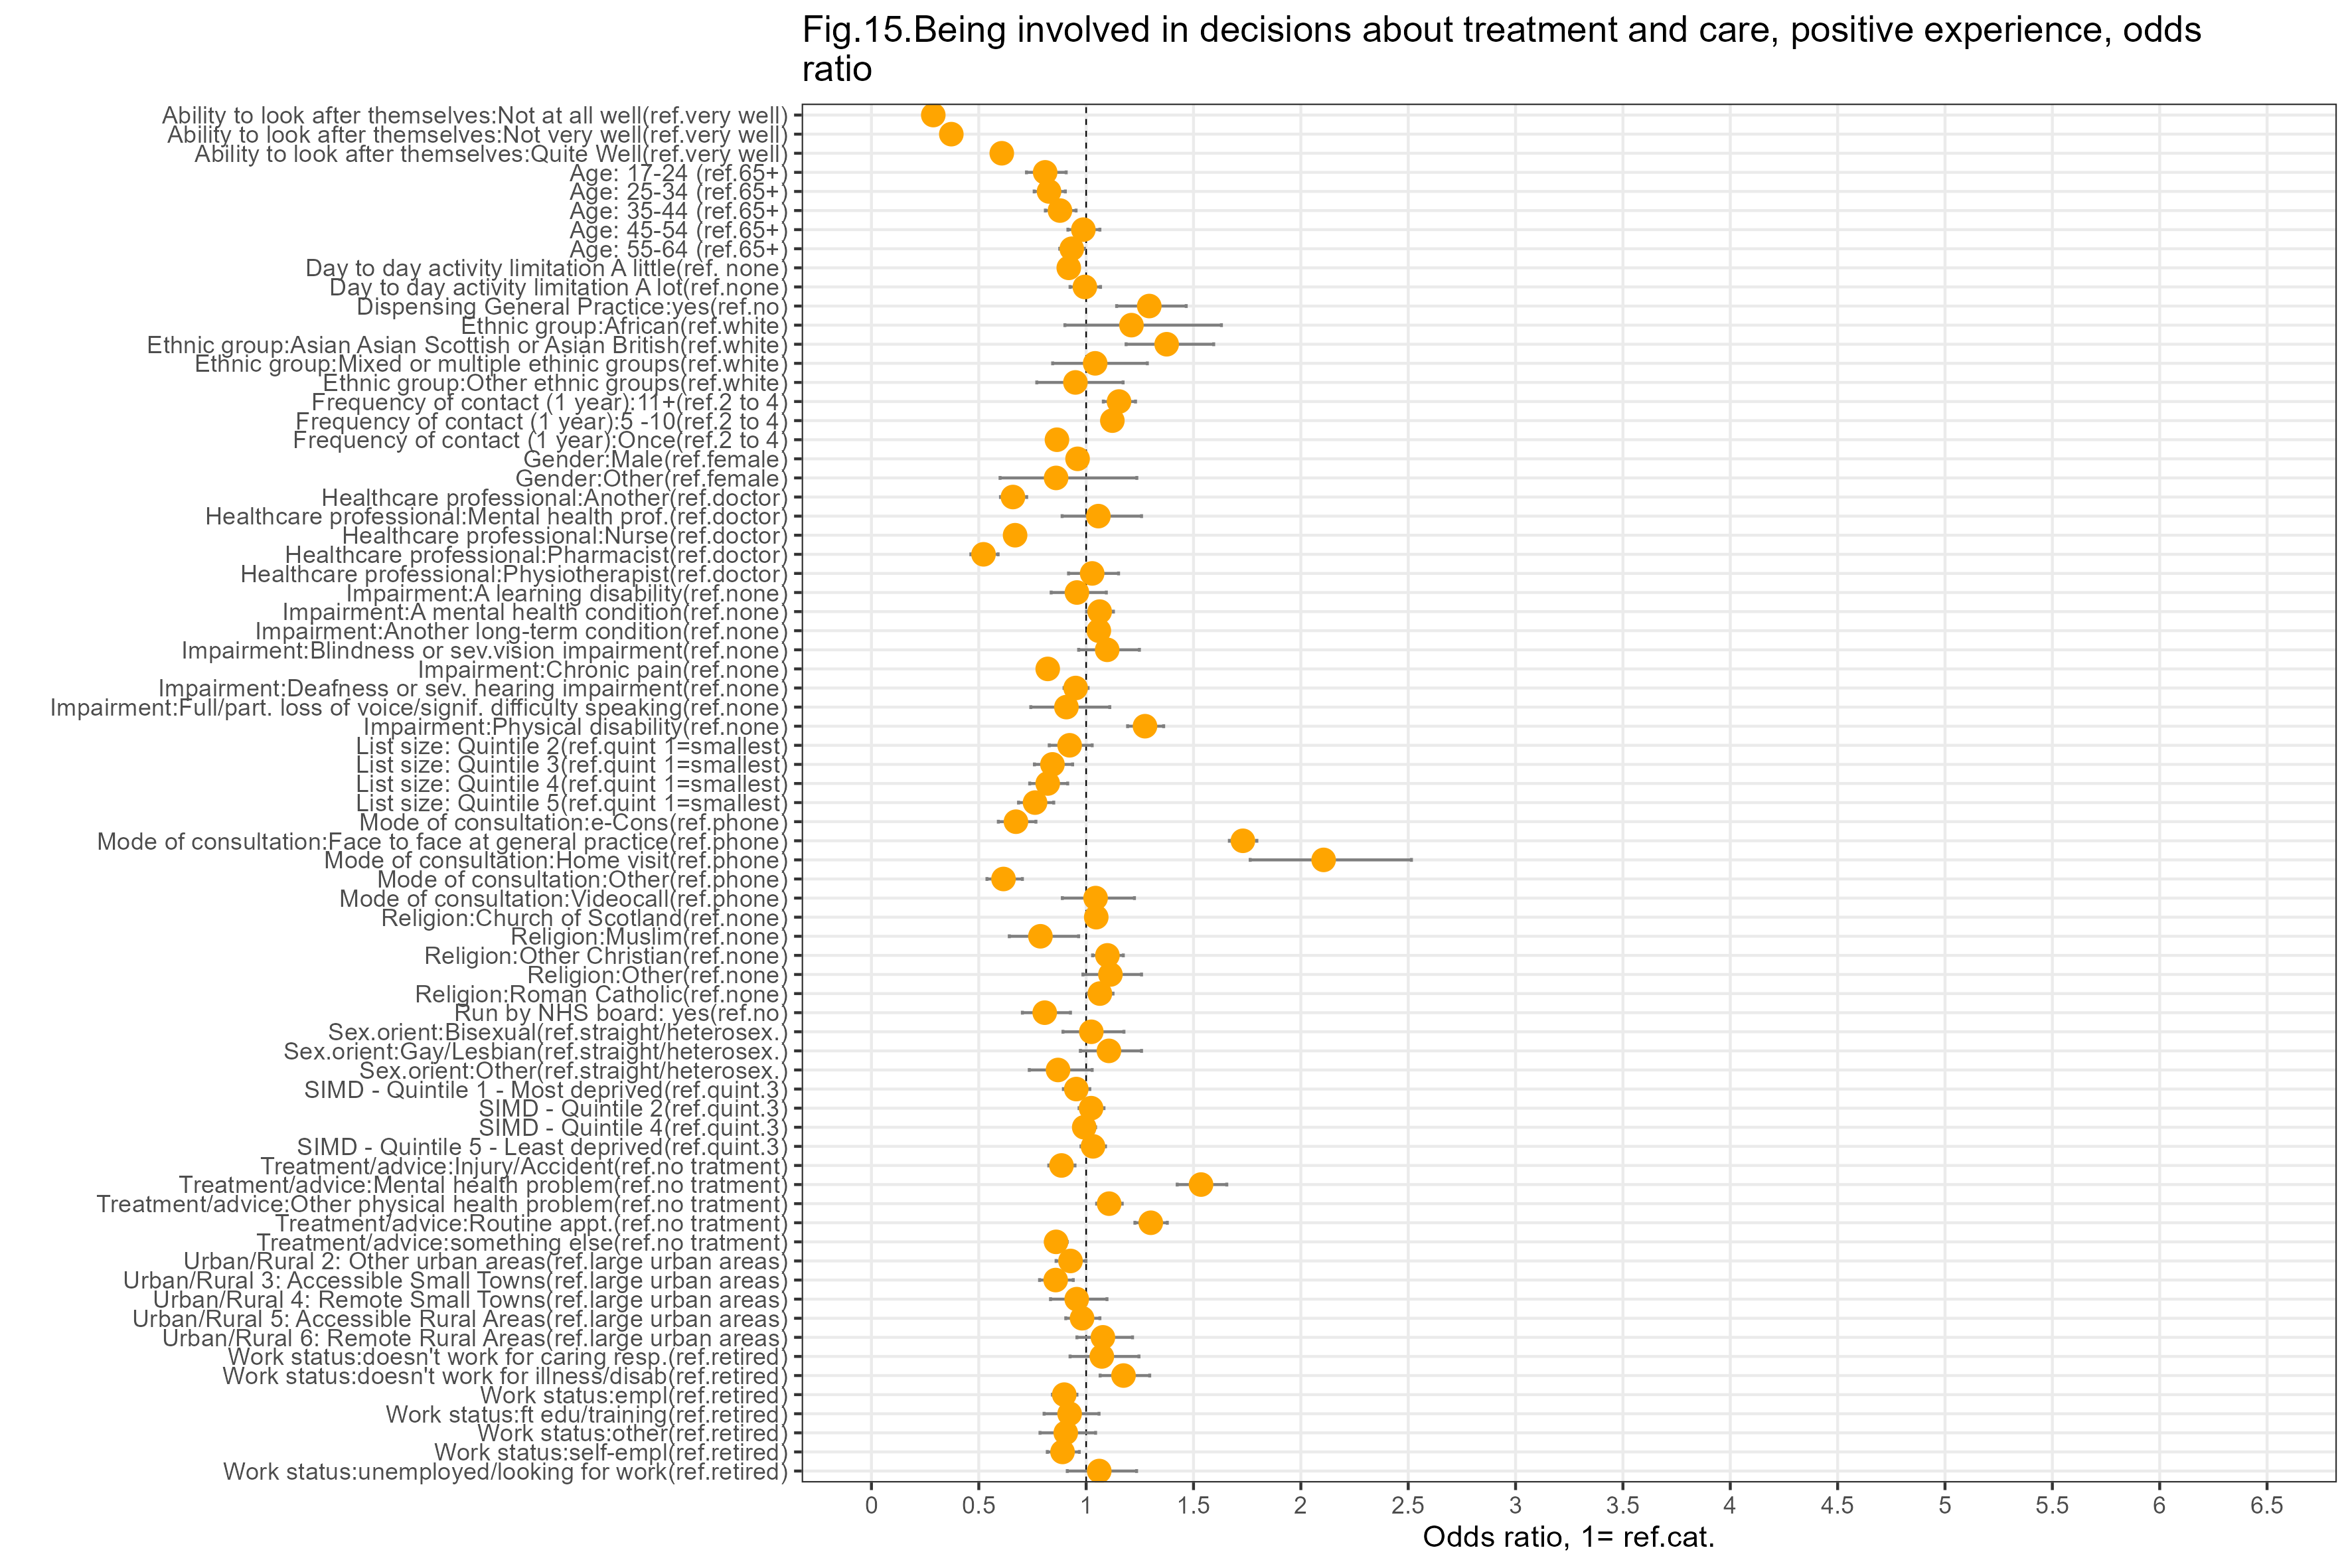
We ran separate models to analyse each of the 13 questions of interest. Each question focuses on a different aspect of care. The first is overall care, and the others are statements describing person-centred care.
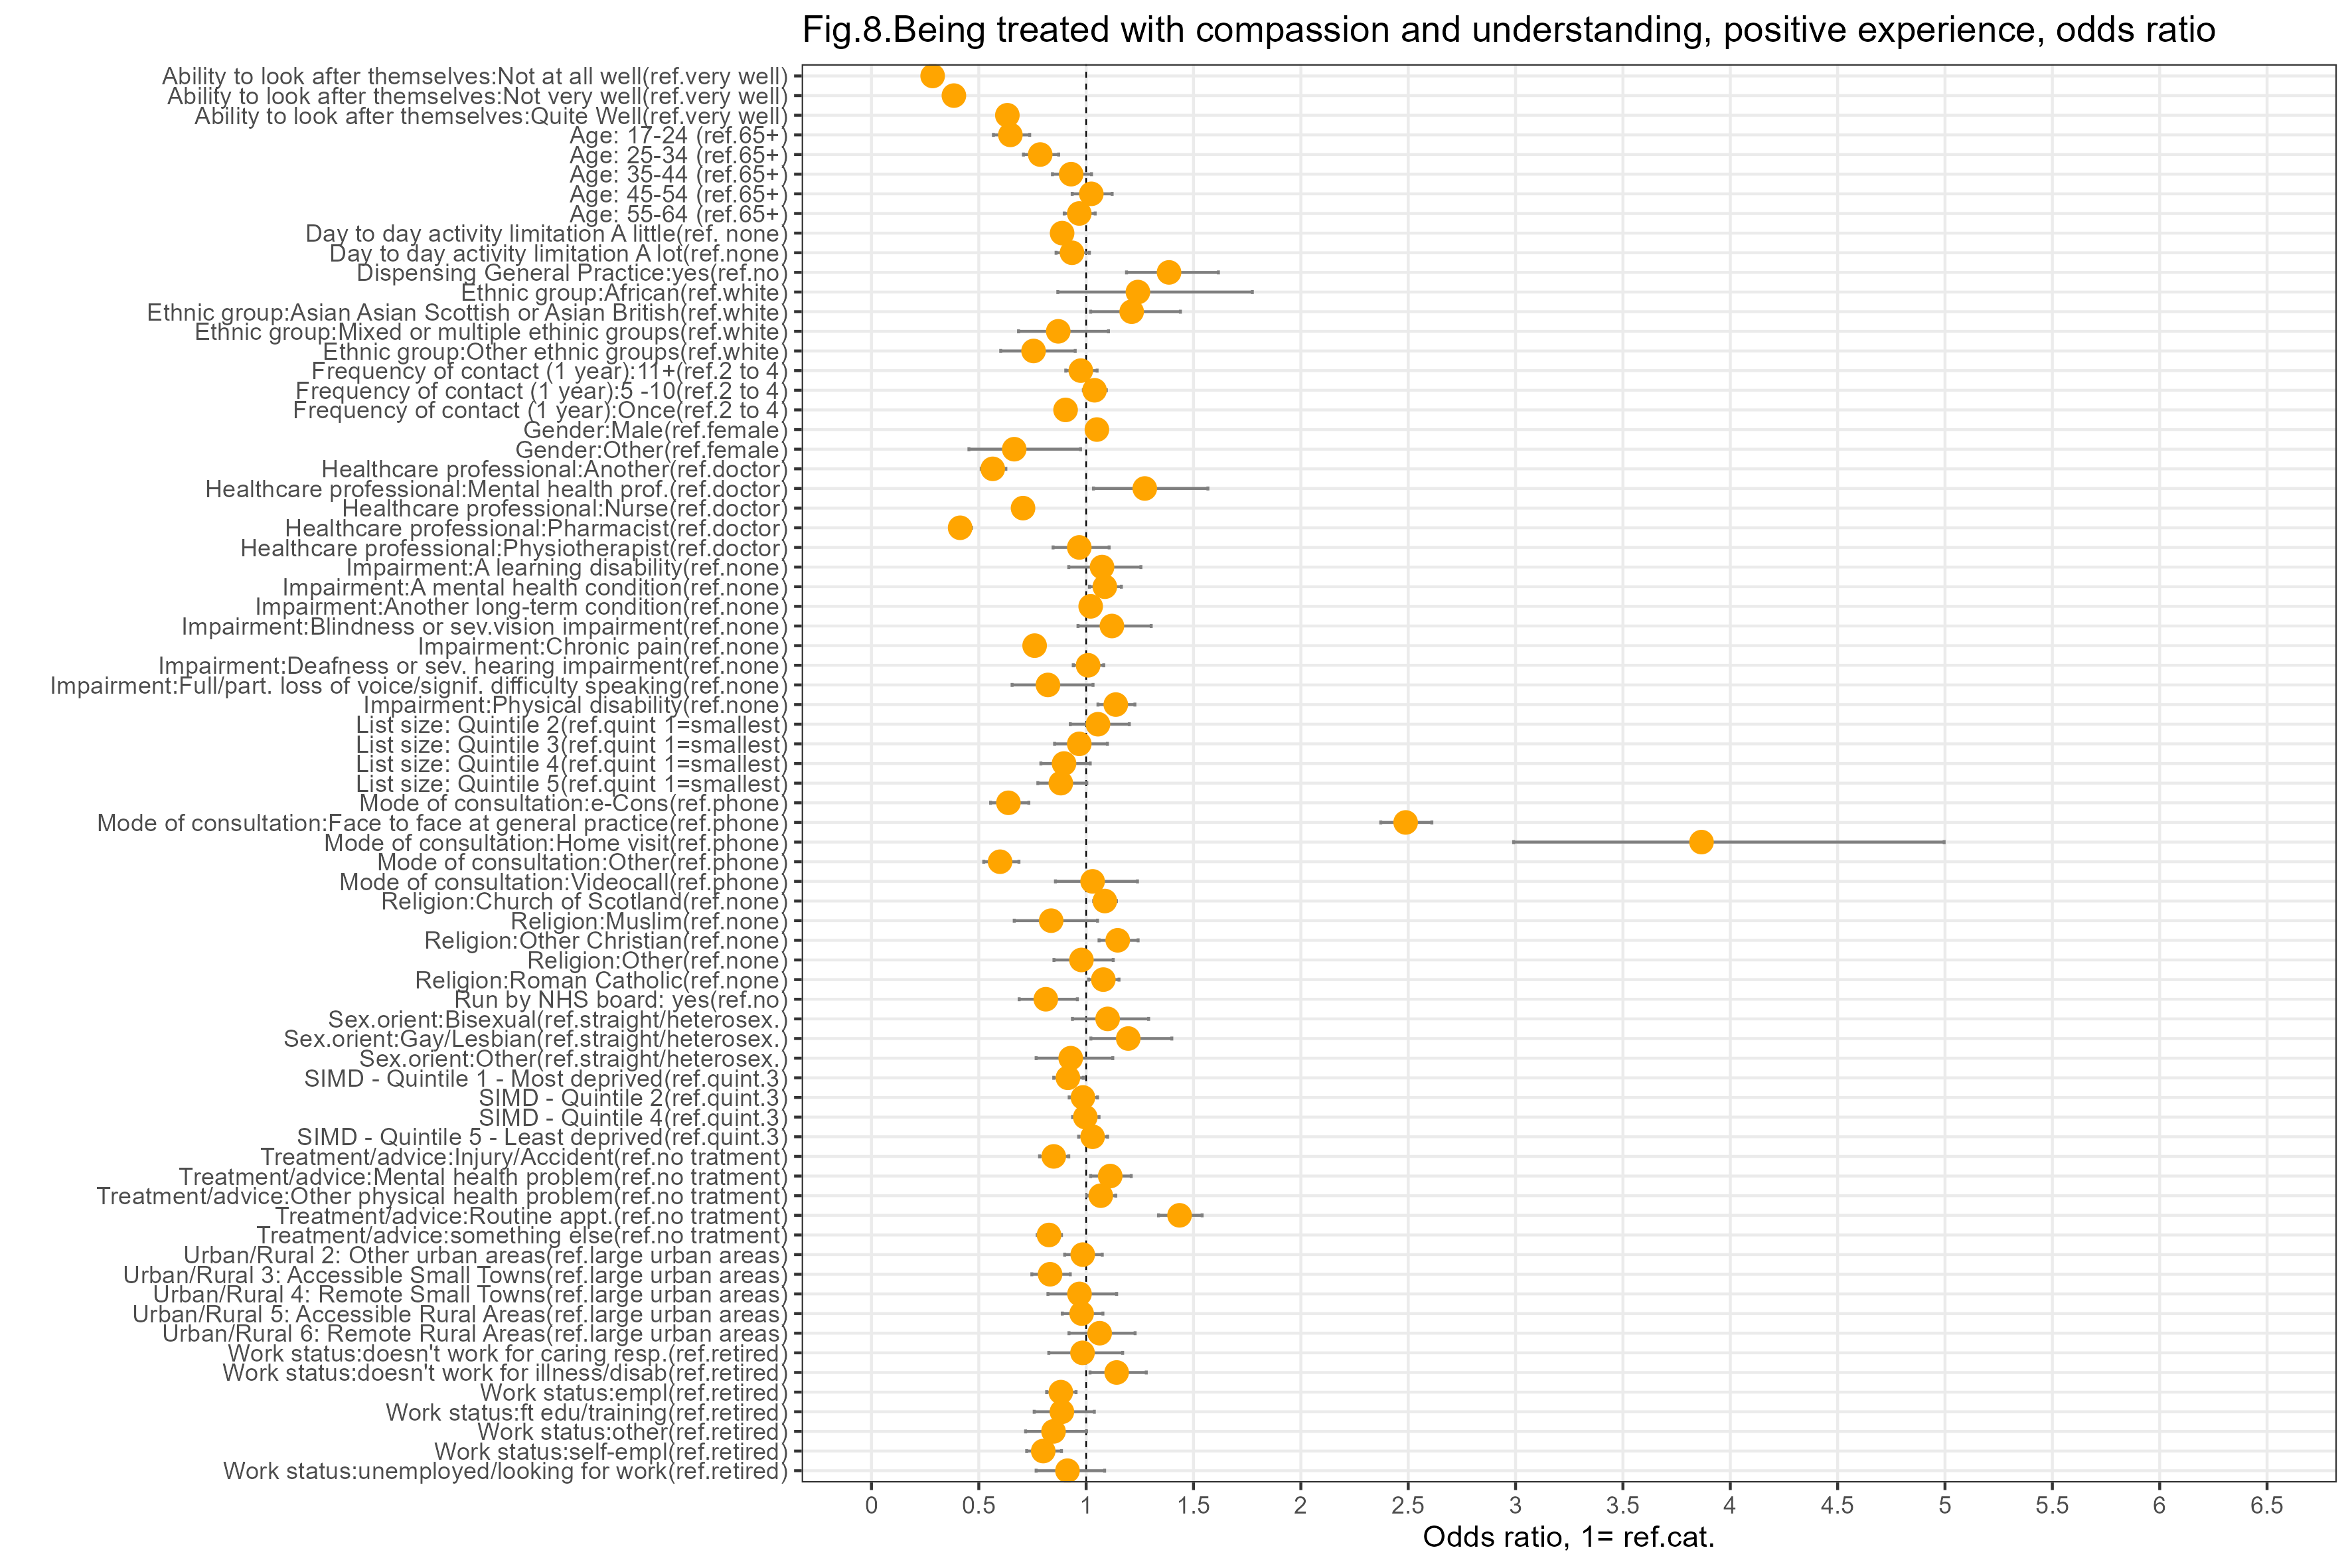
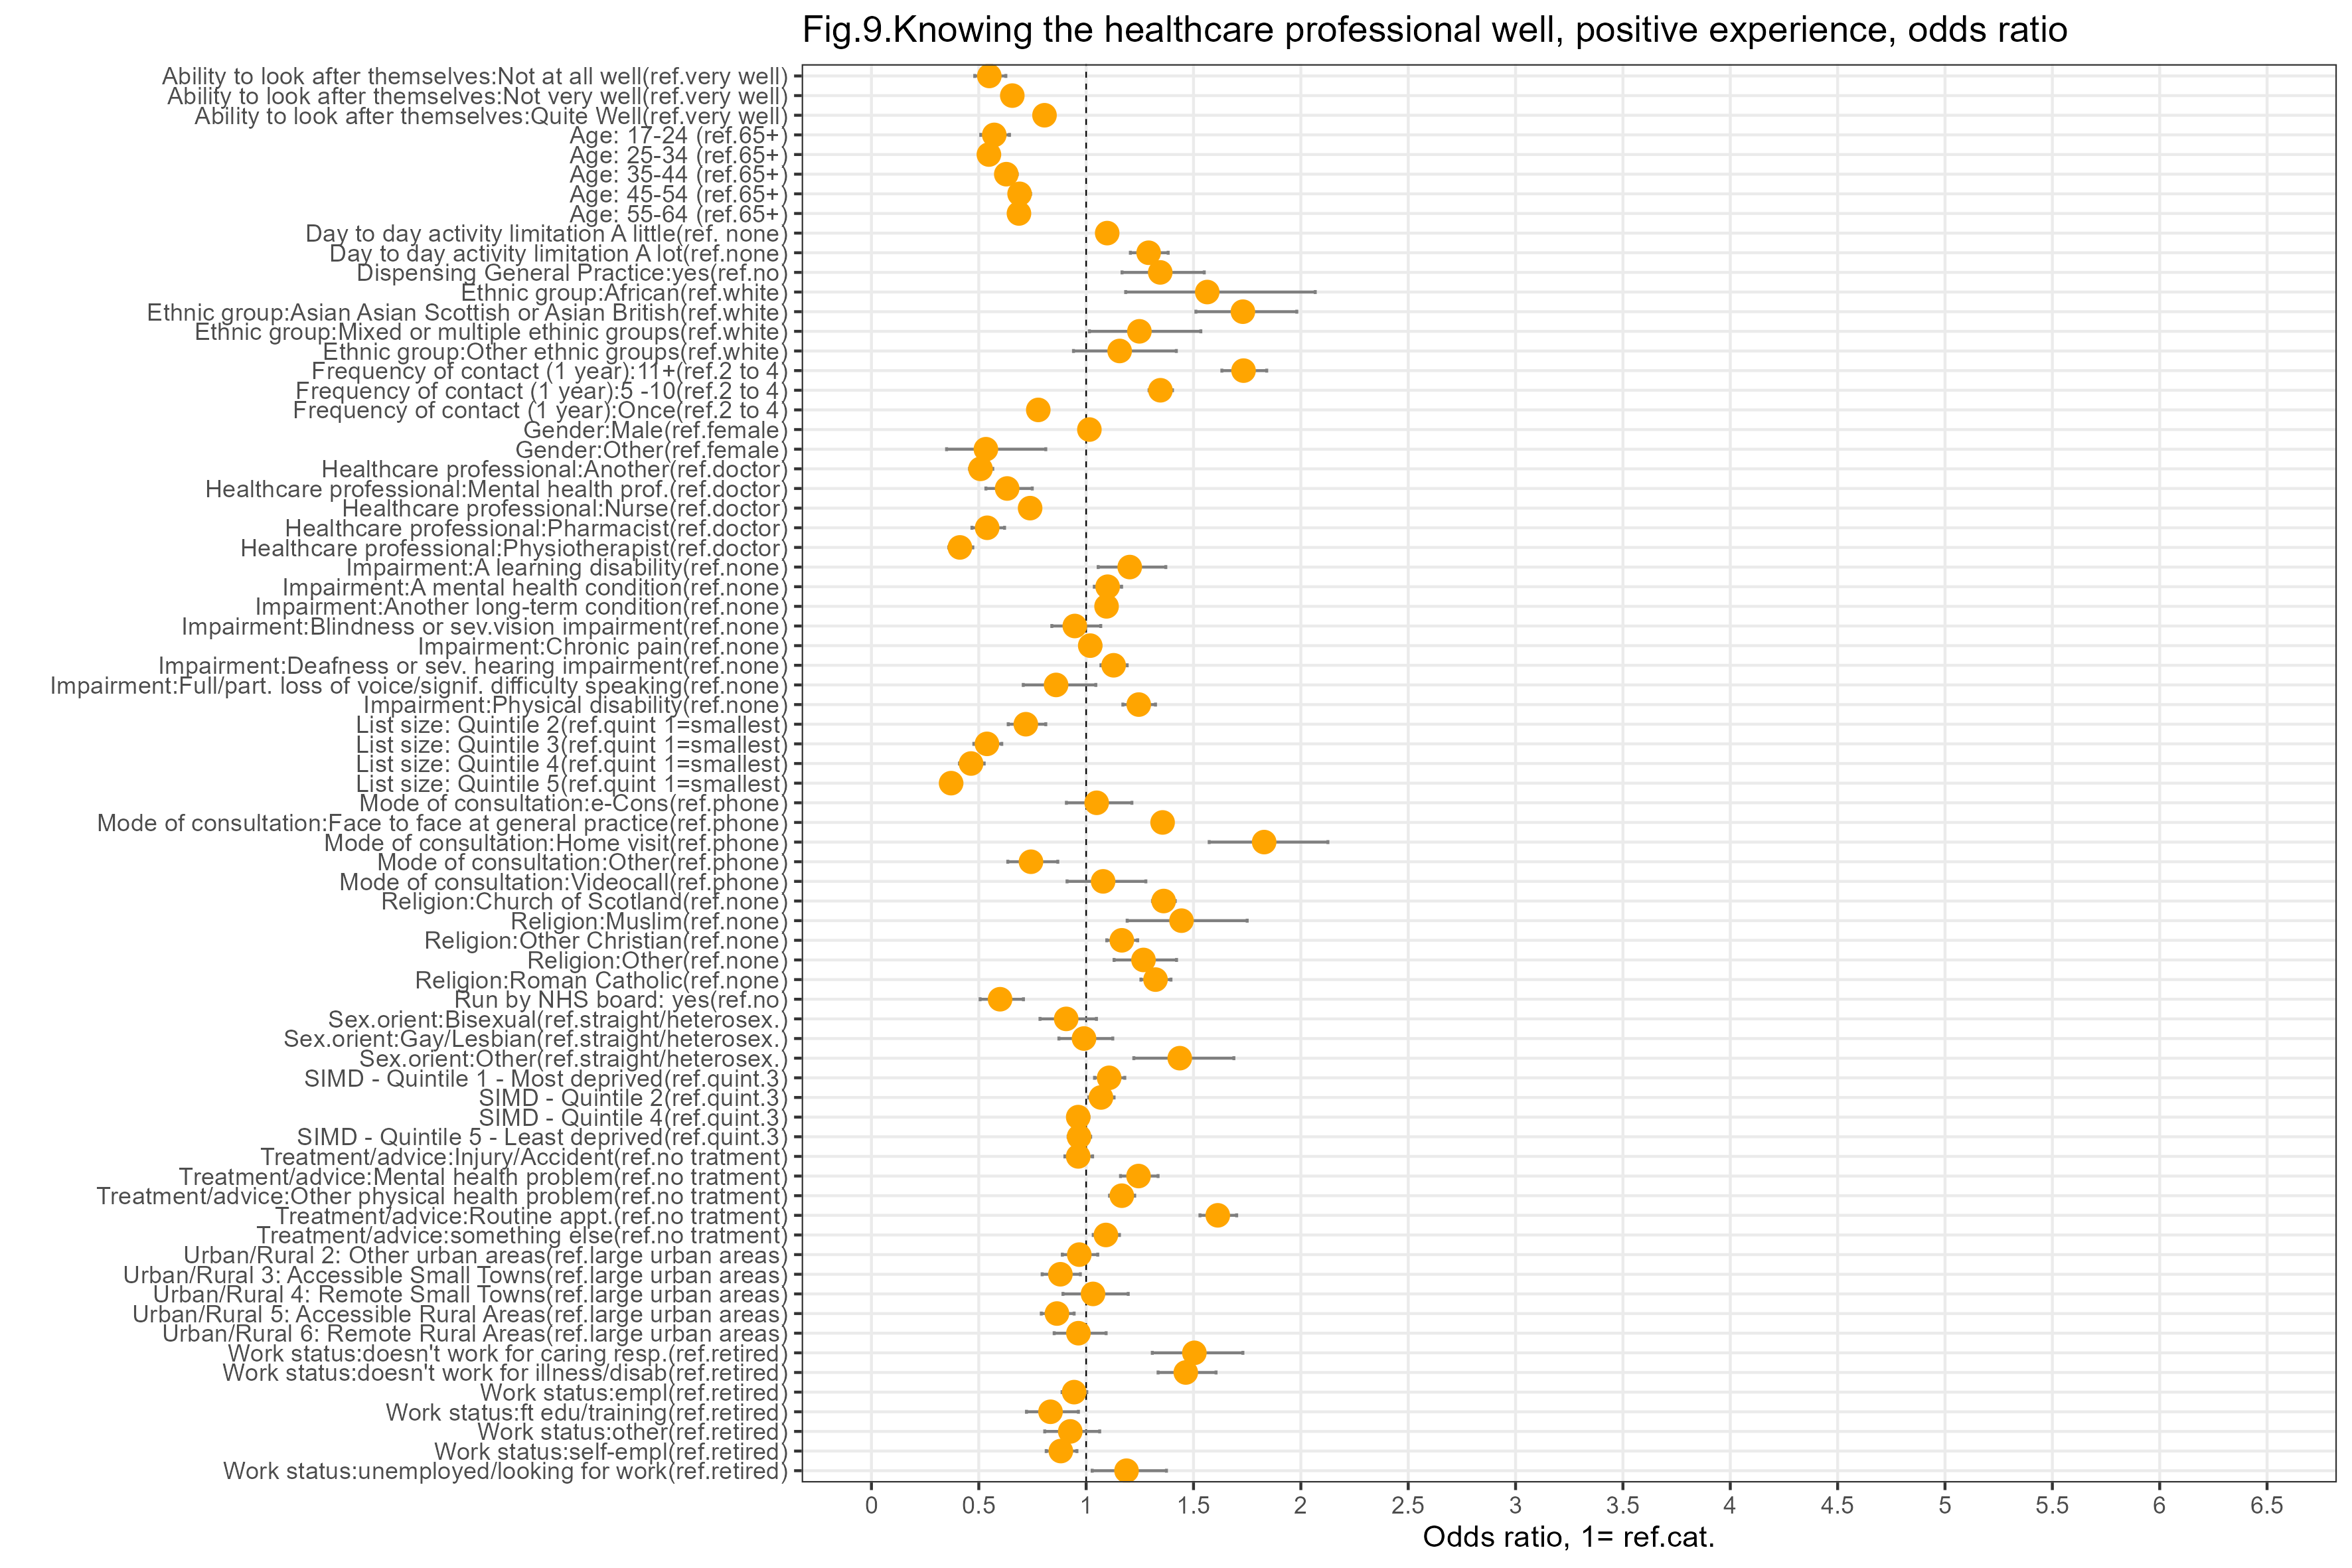
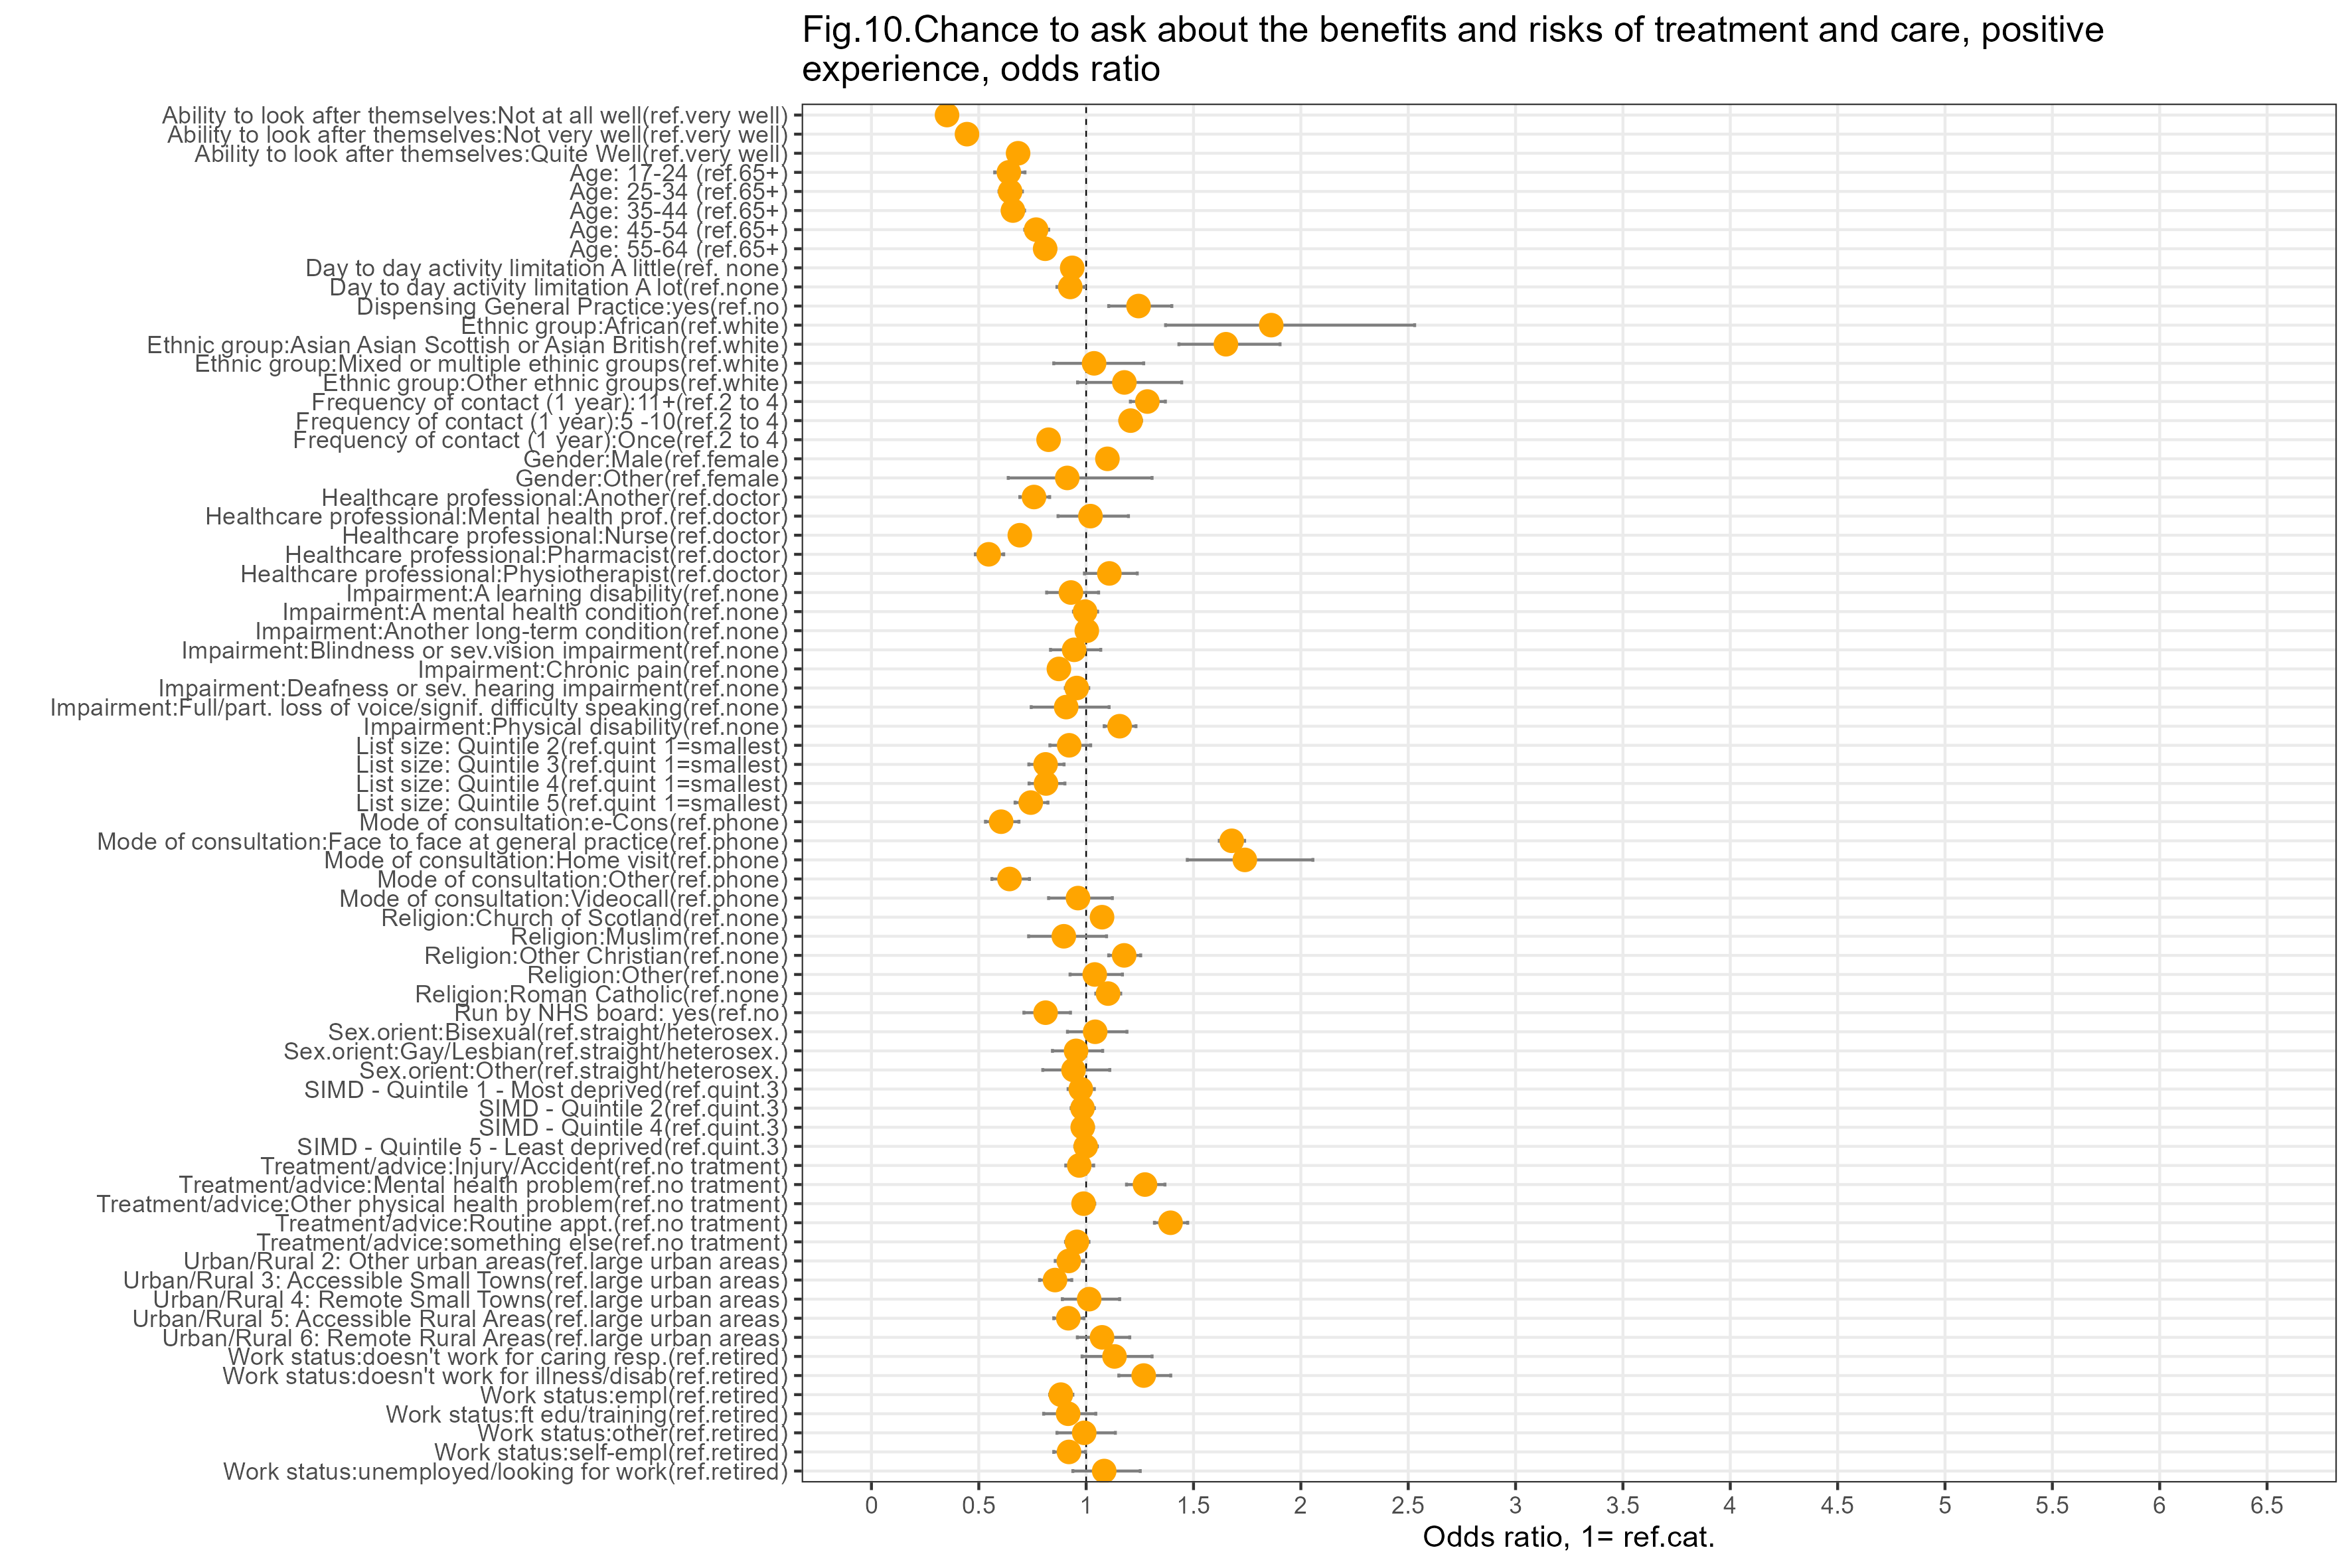
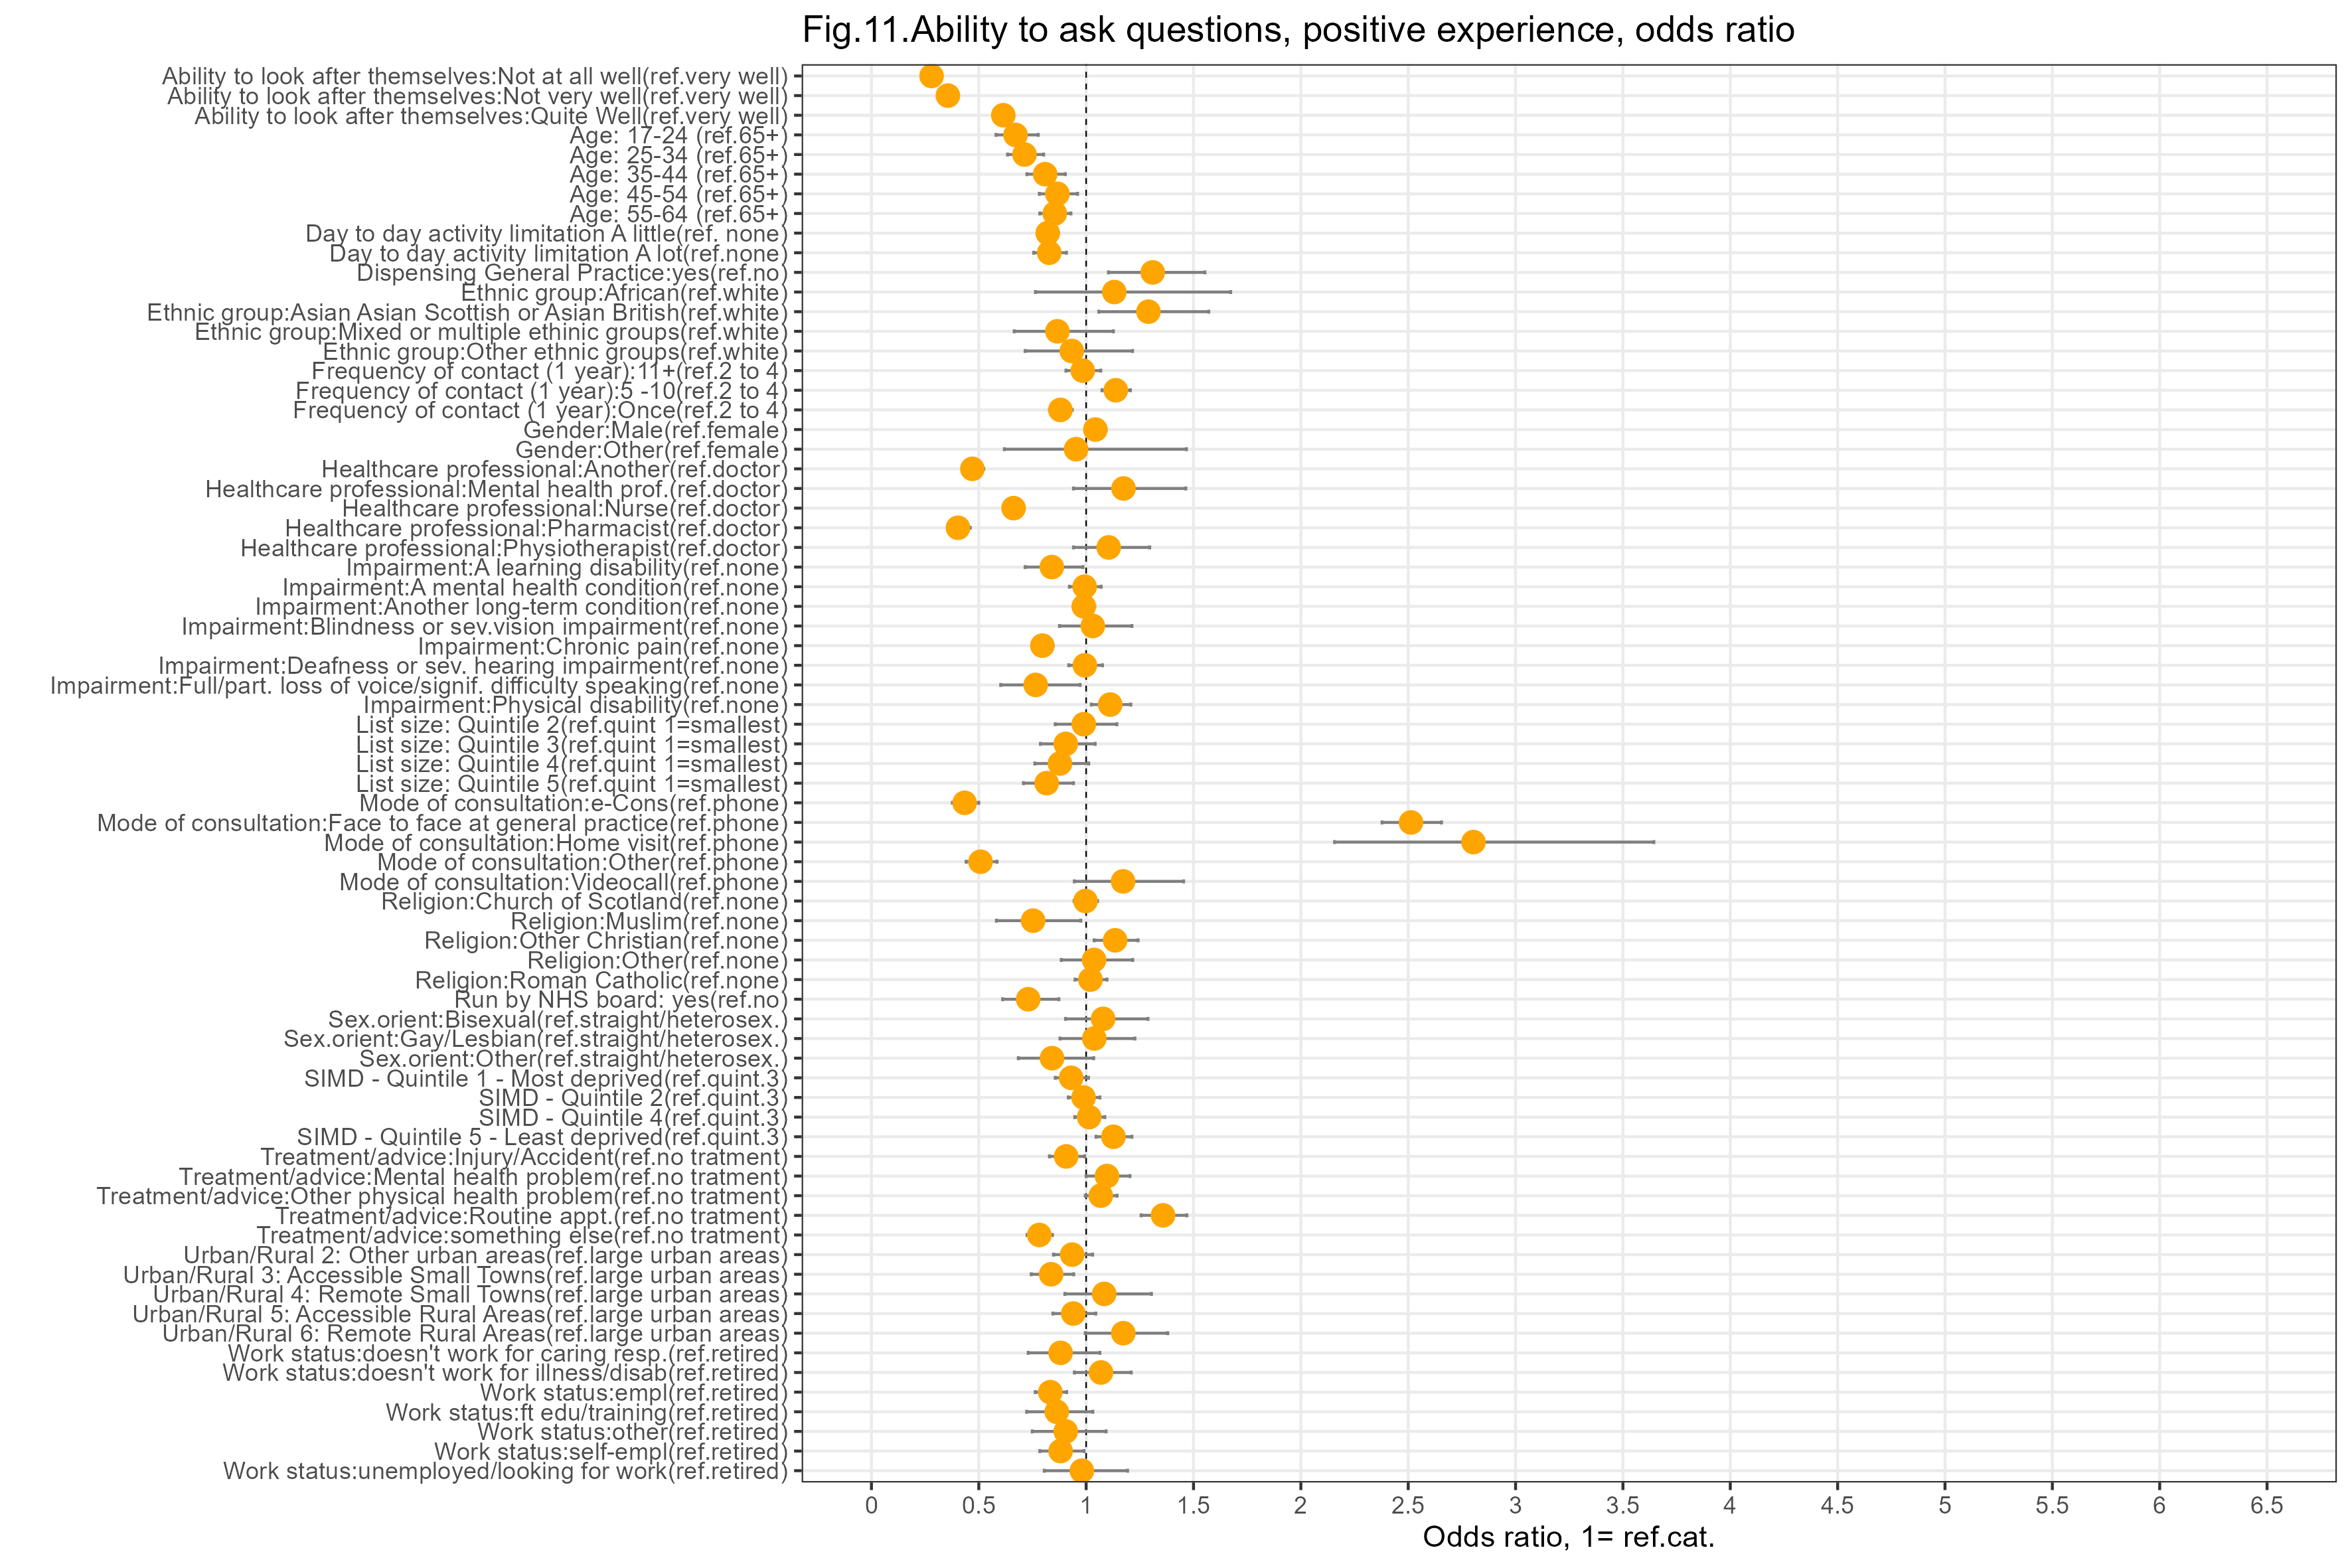
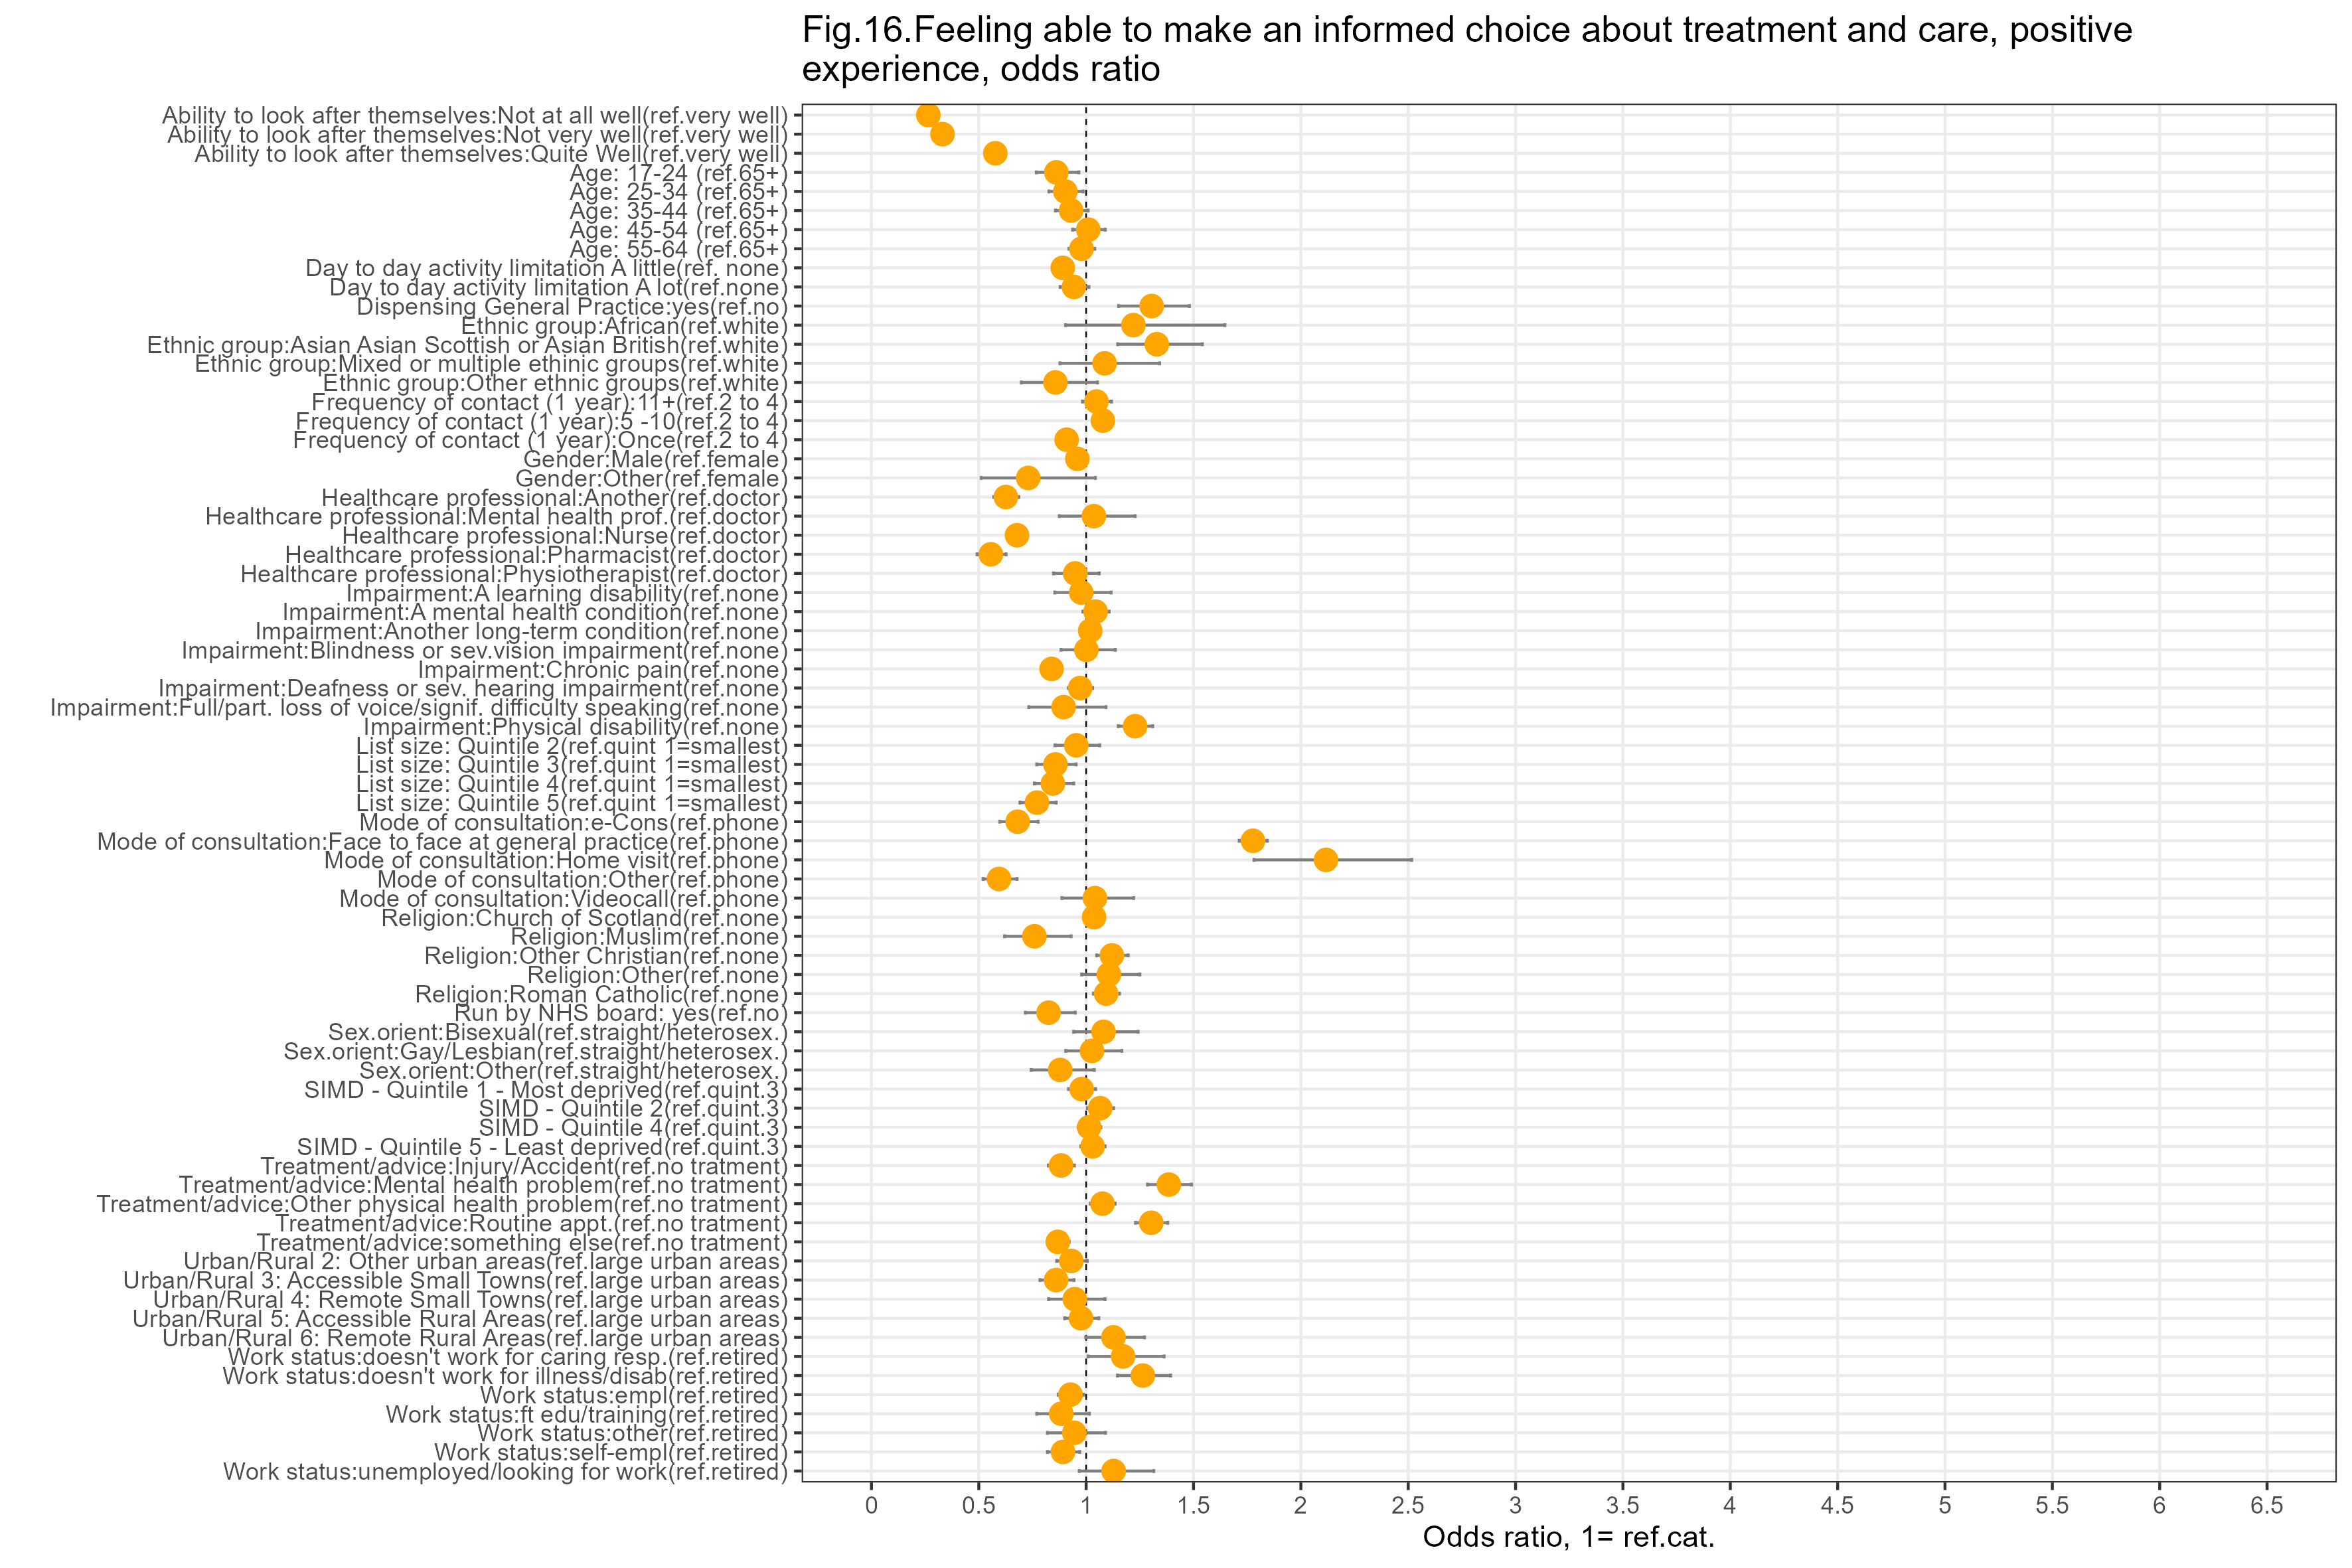
Each graph shows how the likelihood of rating positively a single aspect of care varies for different groups of people.
The results are expressed in odds ratio, that show the likelihood of an outcome compared with a reference group.
If a particular group has an odds ratio of more than 1, they are more likely to rate overall care positively, compared with the reference group, taking into account (controlling for) other characteristics.
If the odds ratio is less than 1, they are less likely to rate overall care positively, compared with the reference group, taking into account other characteristics.
If the odds ratio is 1, they are as likely as the reference group to rate overall care positively, taking into account other characteristics.
For more info about the data and methods, please see the methodology section of the report.

