Health and Care Experience Survey, Variations in Experience 2021/22
In this section you can read how each analysed factor is linked to the likelihood of people rating overall care from their general practice positively. Results for other aspects of care analysed are available on the outcome section in this report.
We have analysed factors related to patients’ individual characteristics, contexts, and characteristics of the consultation with their general practice.
Individual characteristics
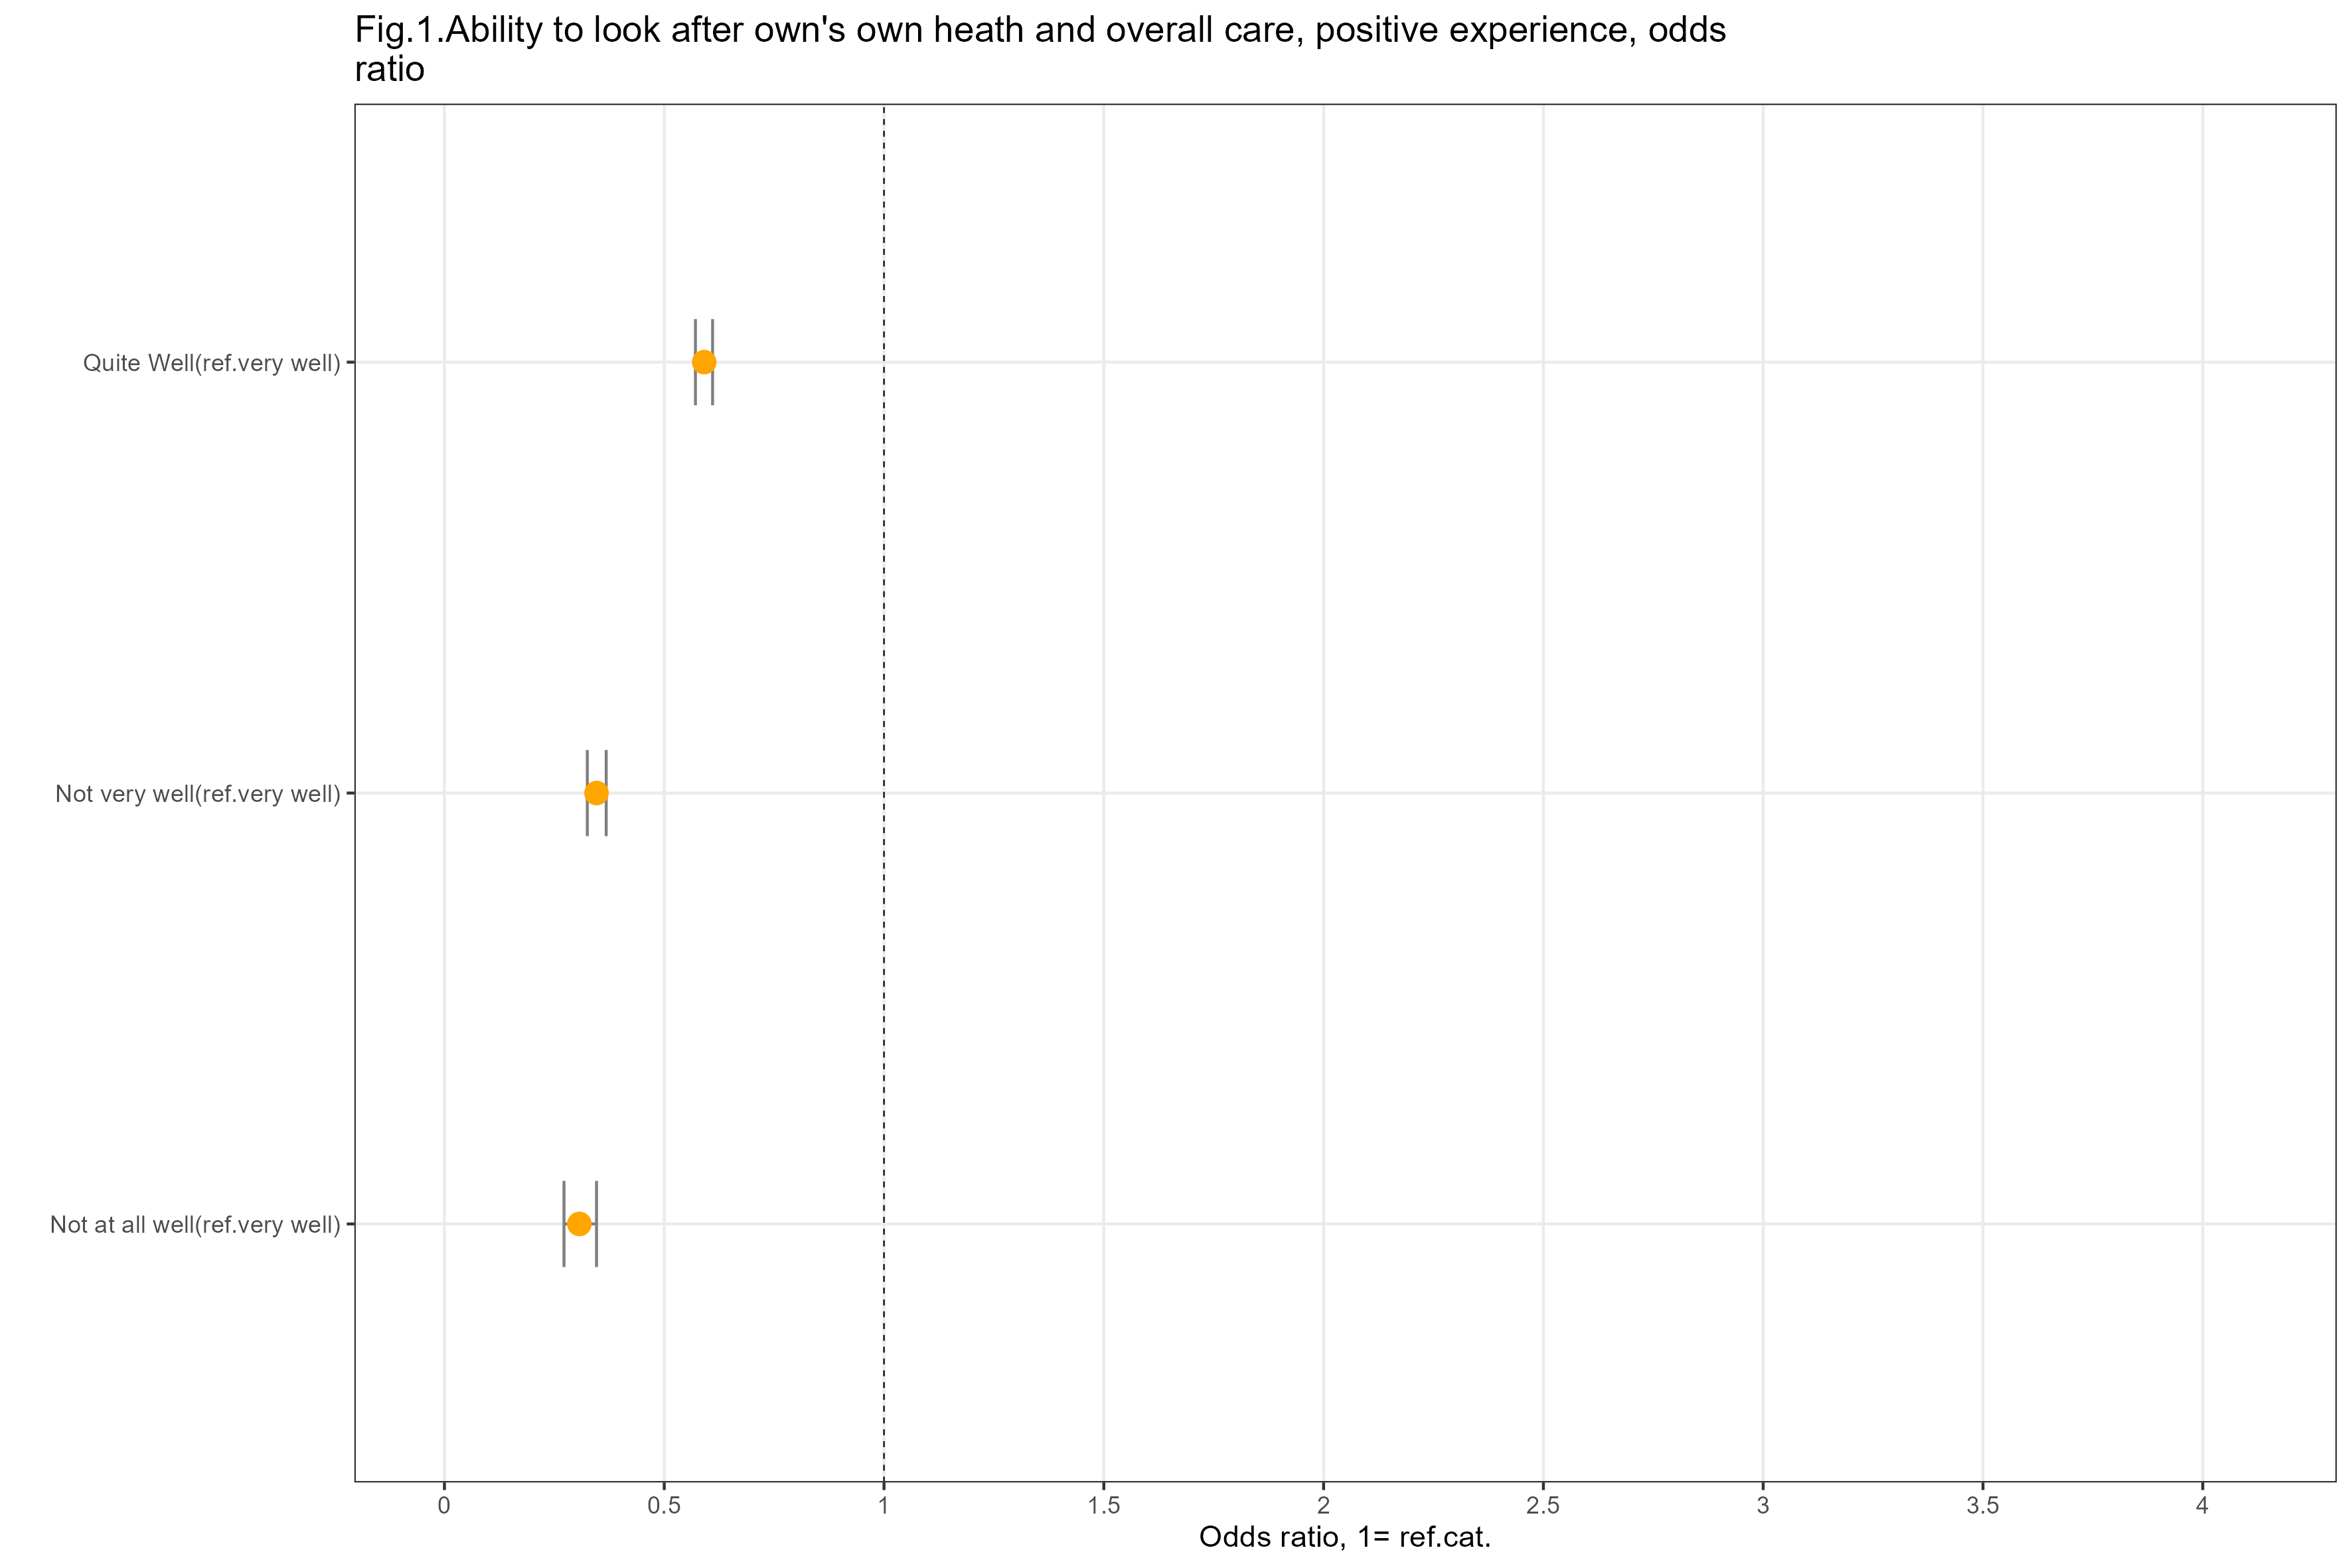
Ability to look after one’s own health
Survey question (Q39): “In general, how well do you feel able to look after your own health?”.
The reference group is people who responded “very well” to the question.
- people who feel better able to look after their own health are more likely to rate overall care positively, compared with people who feel less able to look after their own health
The results (OR and confidence intervals) for this factor are shown in the graph below.
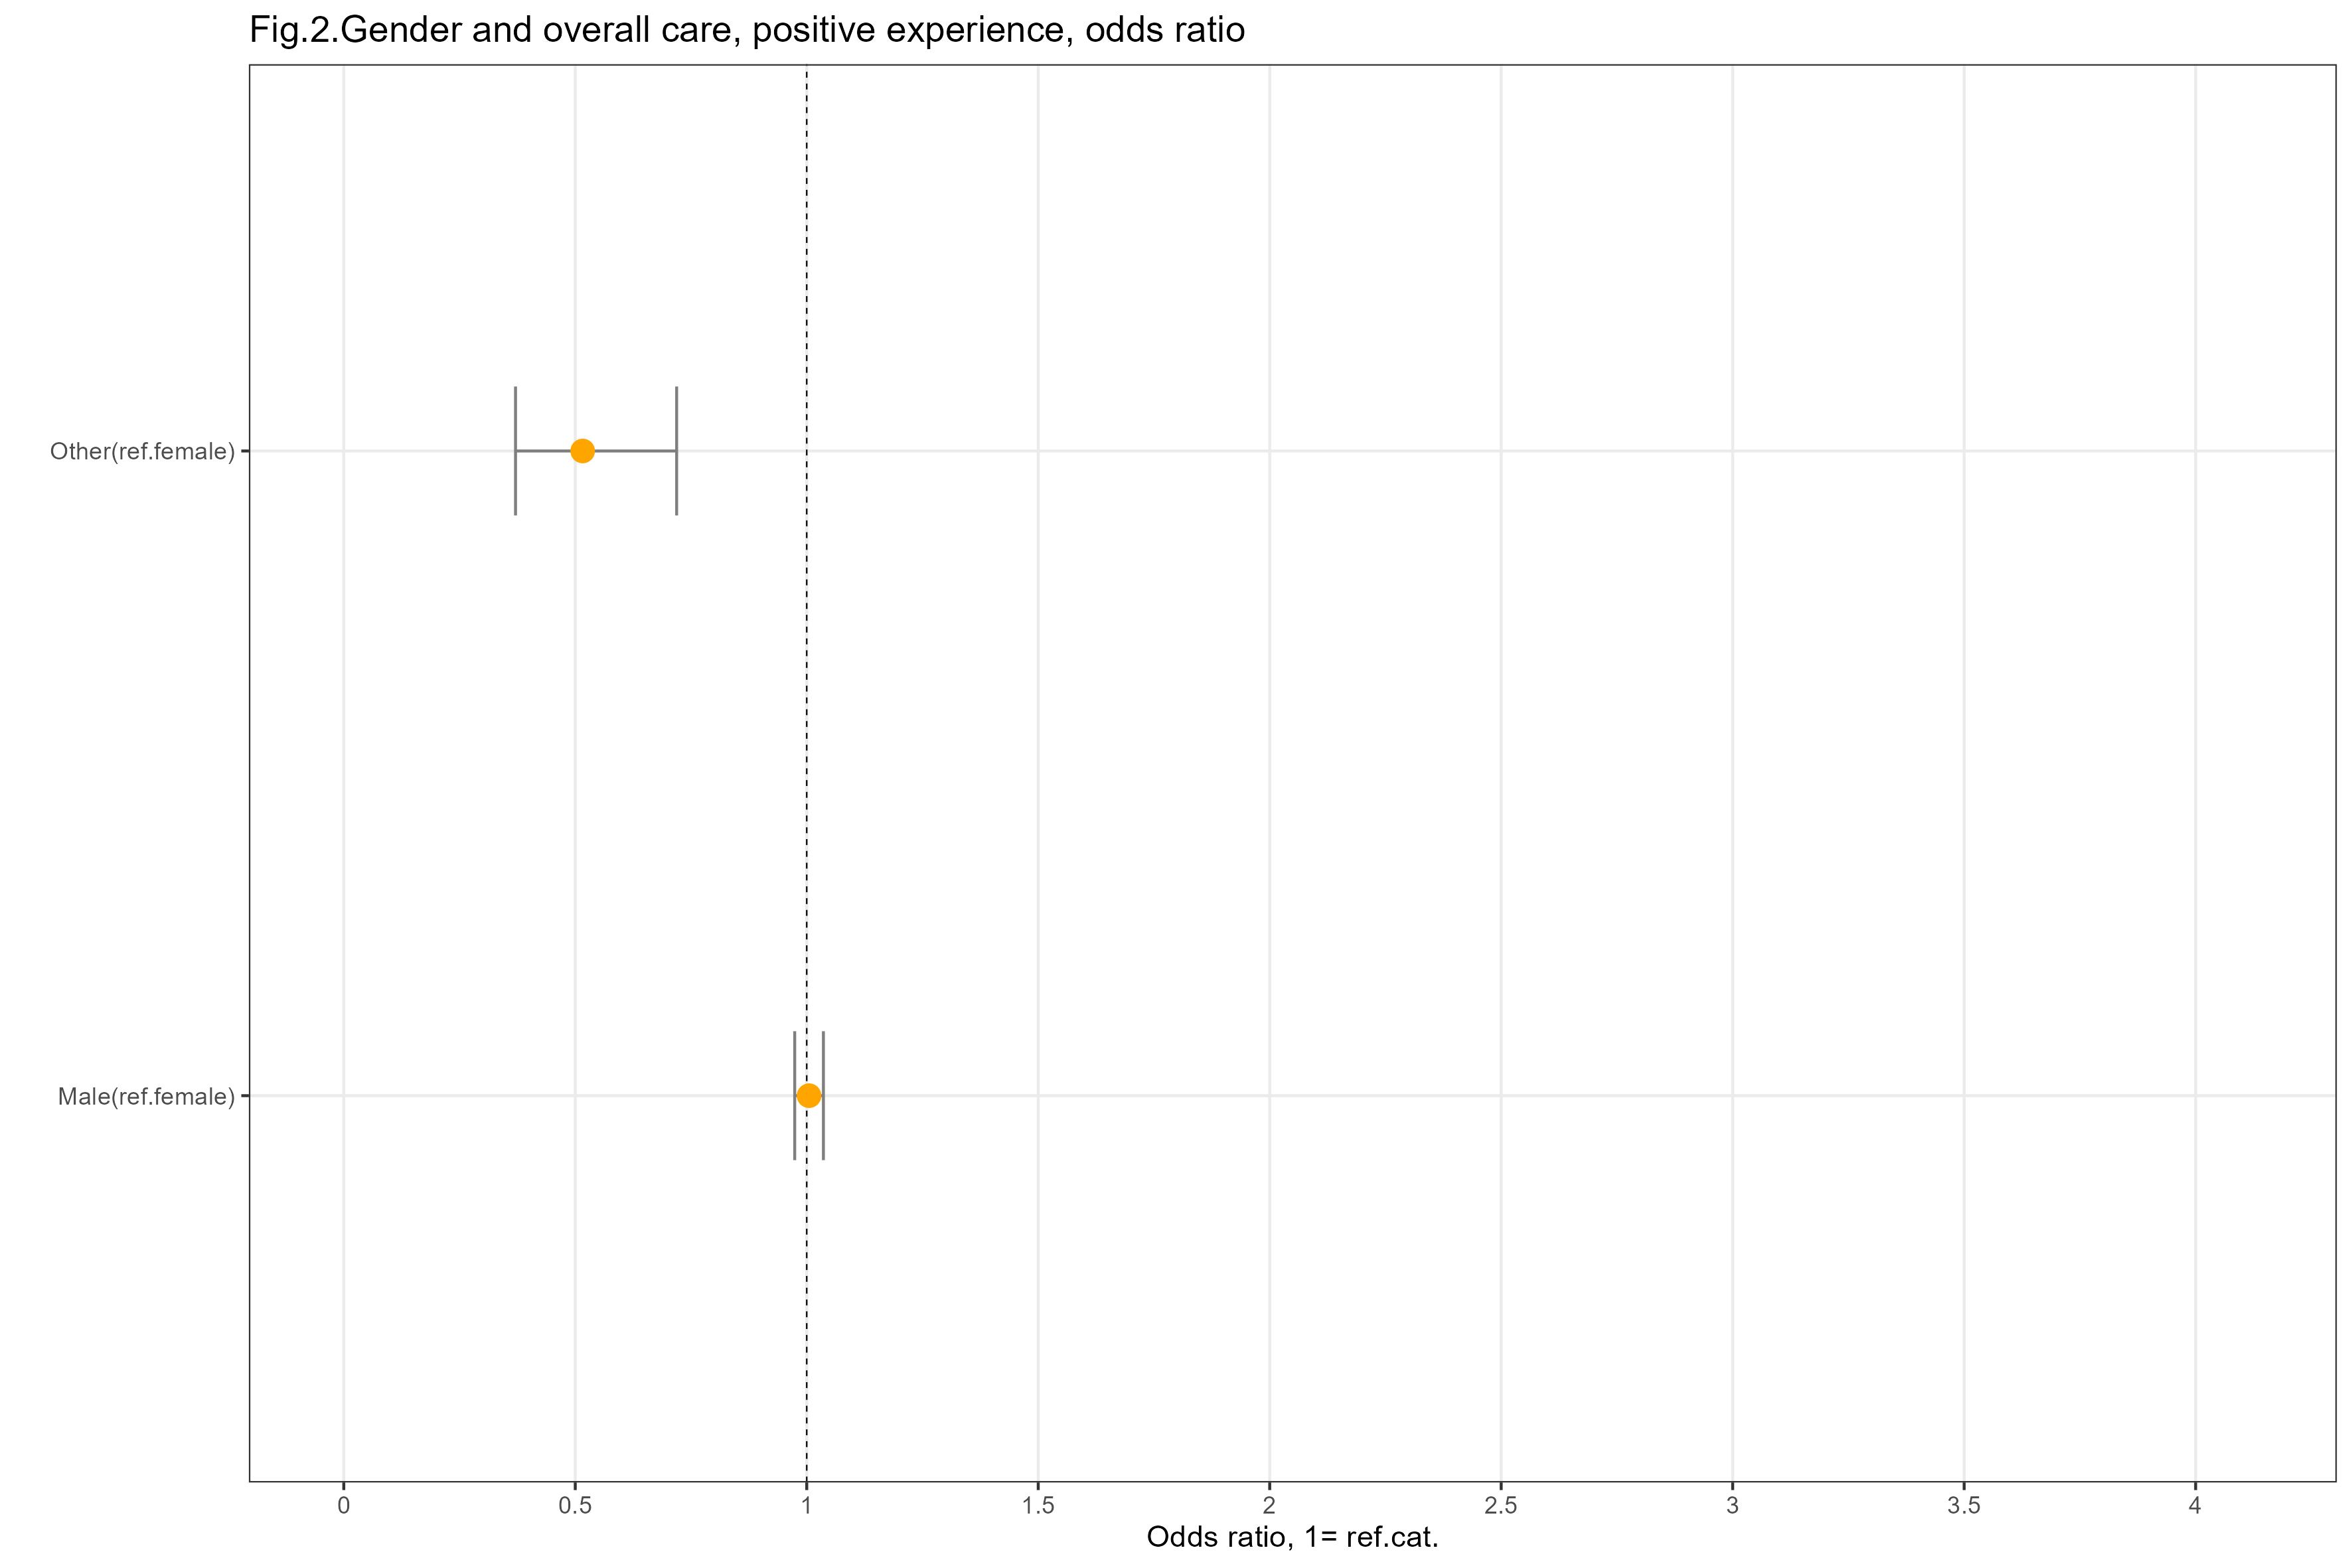
Gender
Survey question (Q42): “What best describes your gender?”.
The reference group is people who responded “female” to the question.
people responding “other” are less likely to rate overall care positively, compared with females
people responding “male” have a similar likelihood of rating overall care positively, compared with females
The results (OR and confidence intervals) for this factor are shown in the graph below.
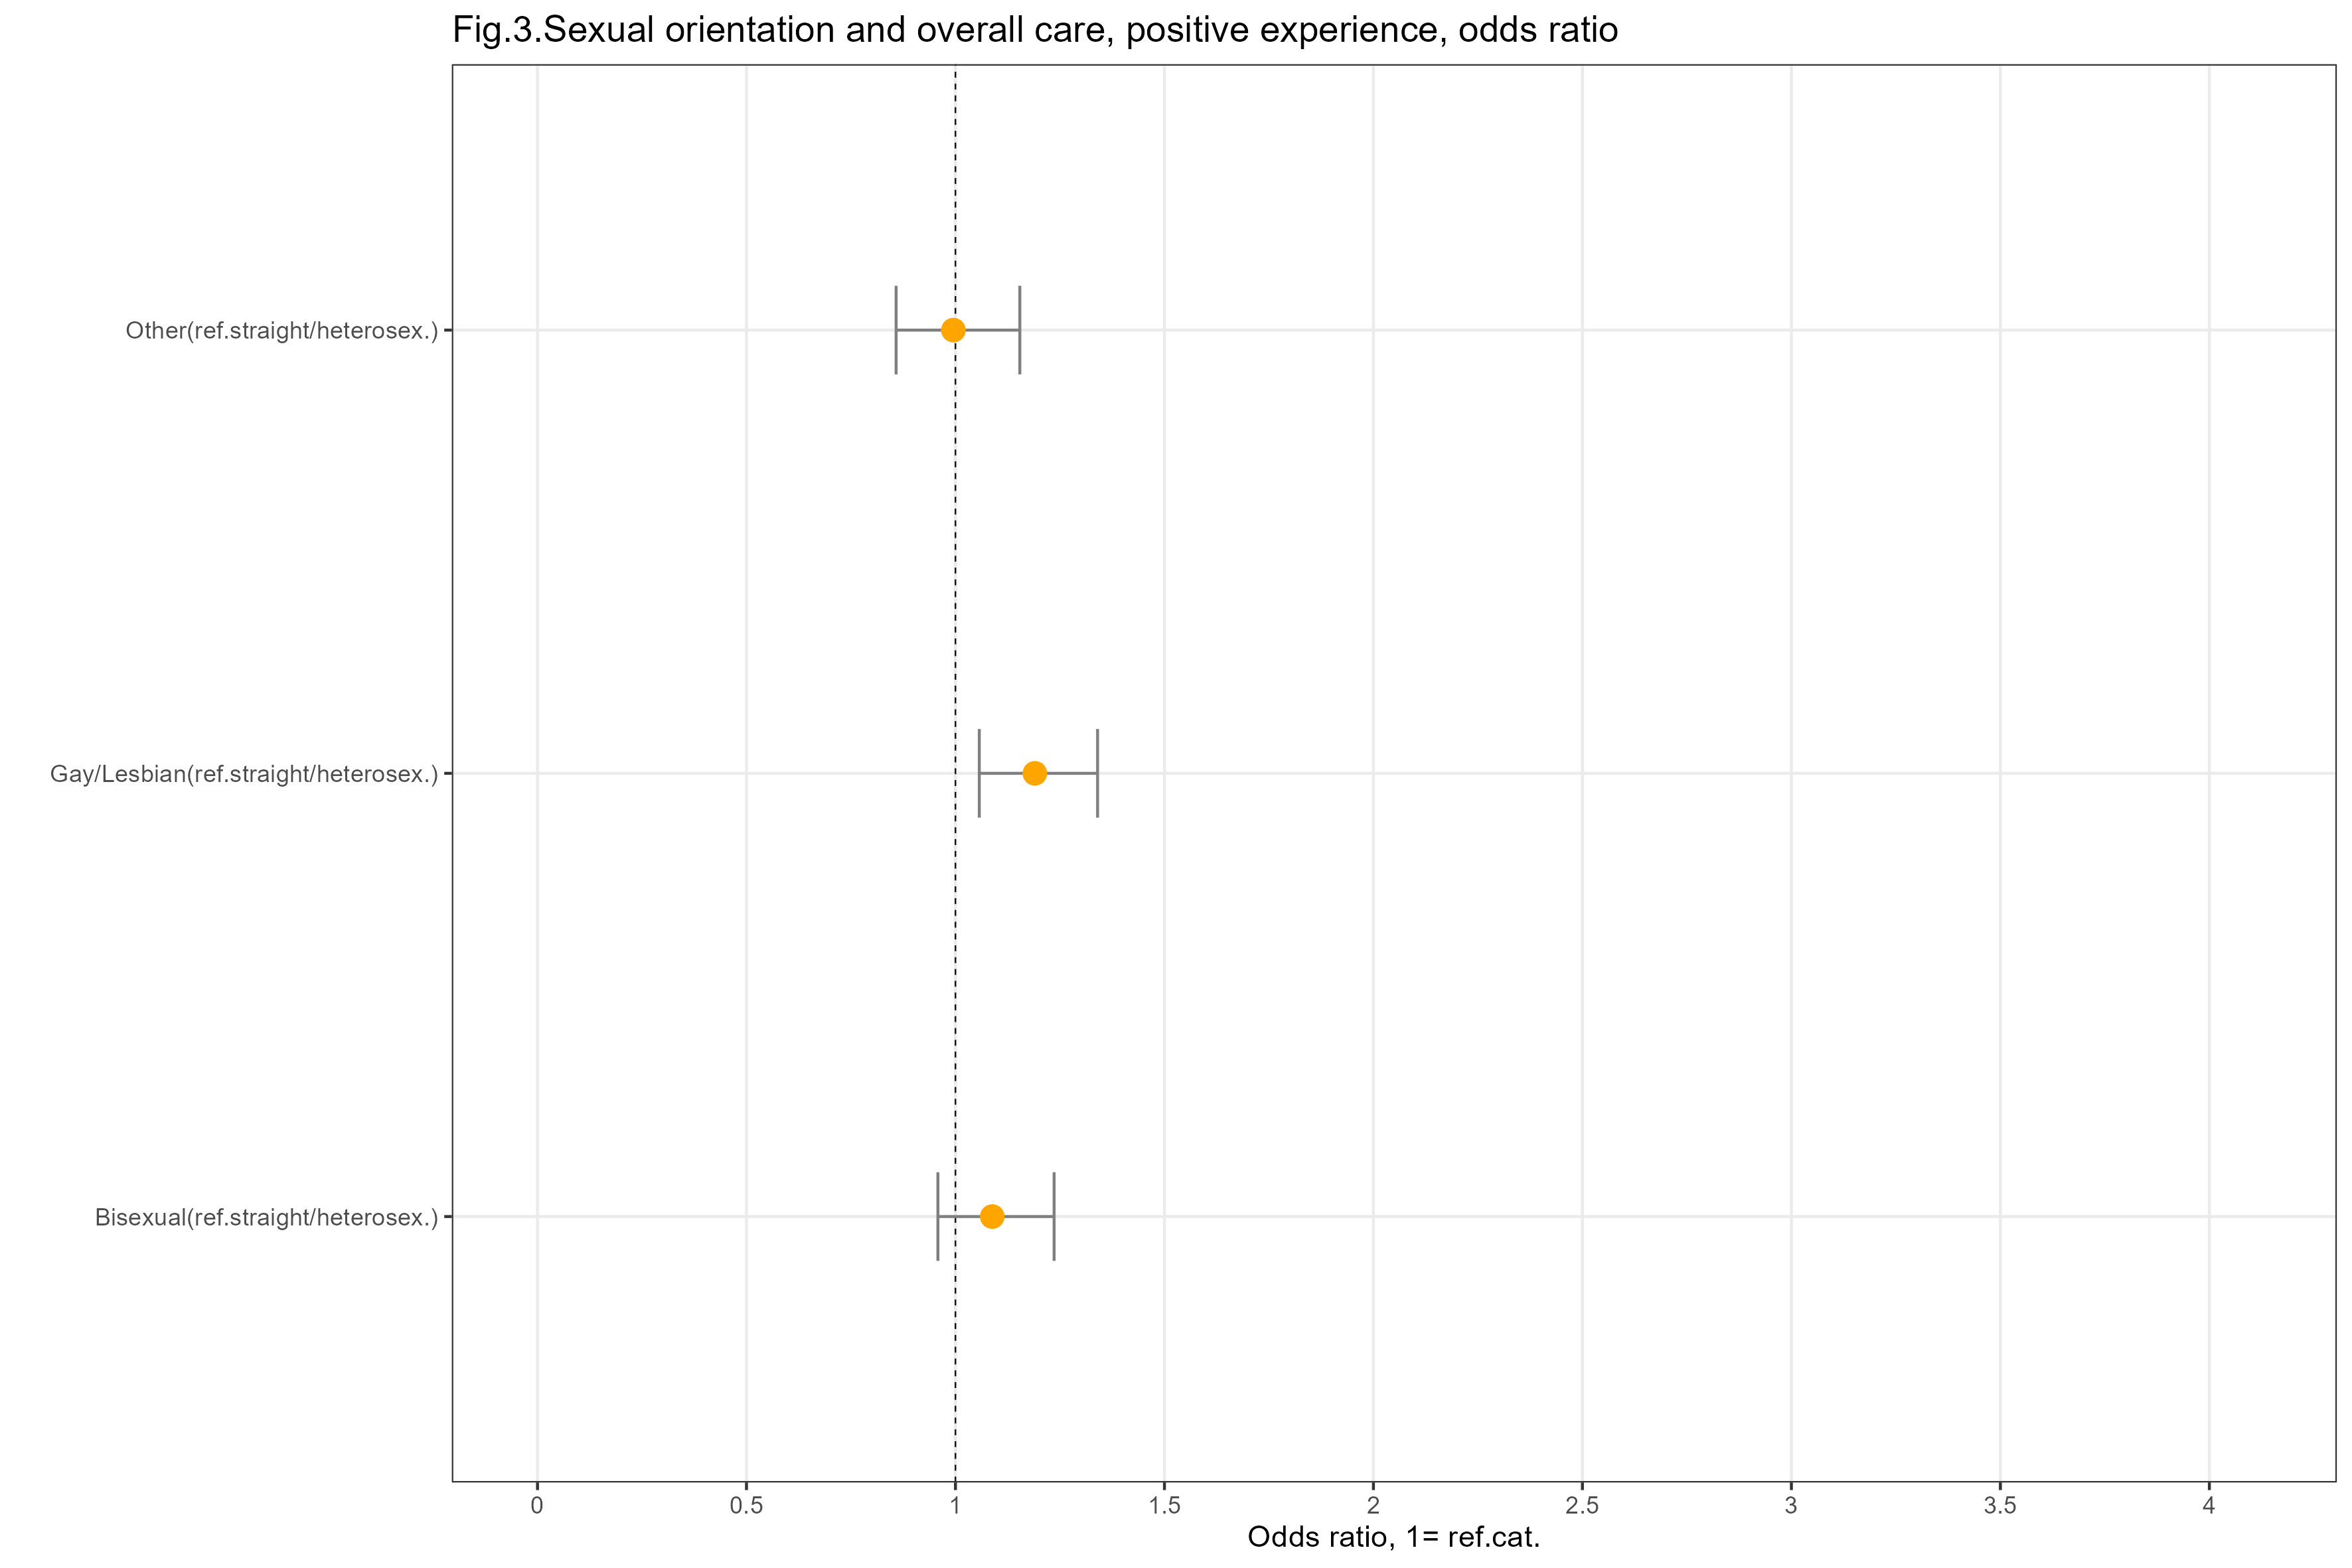
Sexual orientation
Survey question (Q44): “Which of the following options best describes your sexual orientation?”
The reference group is people who responded “heterosexual / straight” to the question.
people who describe themselves as “gay / lesbian” are slightly more likely to rate overall care positively, compared with the reference group
people responding “bisexual” or “other” have a similar likelihood of rating overall care positively, compared with the reference group
The results (OR and confidence intervals) for this factor are shown in the graph below.
Ethnic group
Survey question (Q43): “What best describes your ethnic group?”.
The reference group is people who responded “White” to the question.
people responding “Asian, Asian Scottish or Asian British”, “Mixed or multiple ethnic groups” and all other ethnic groups have a similar likelihood of rating overall care positively, compared with the reference group
people responding “African” are more likely to rate overall care positively, compared with the reference group
All other ethnic groups includes the response options “Caribbean or Black” and “Other ethnic group”.
The results (OR and confidence intervals) for this factor are shown in the graph below.
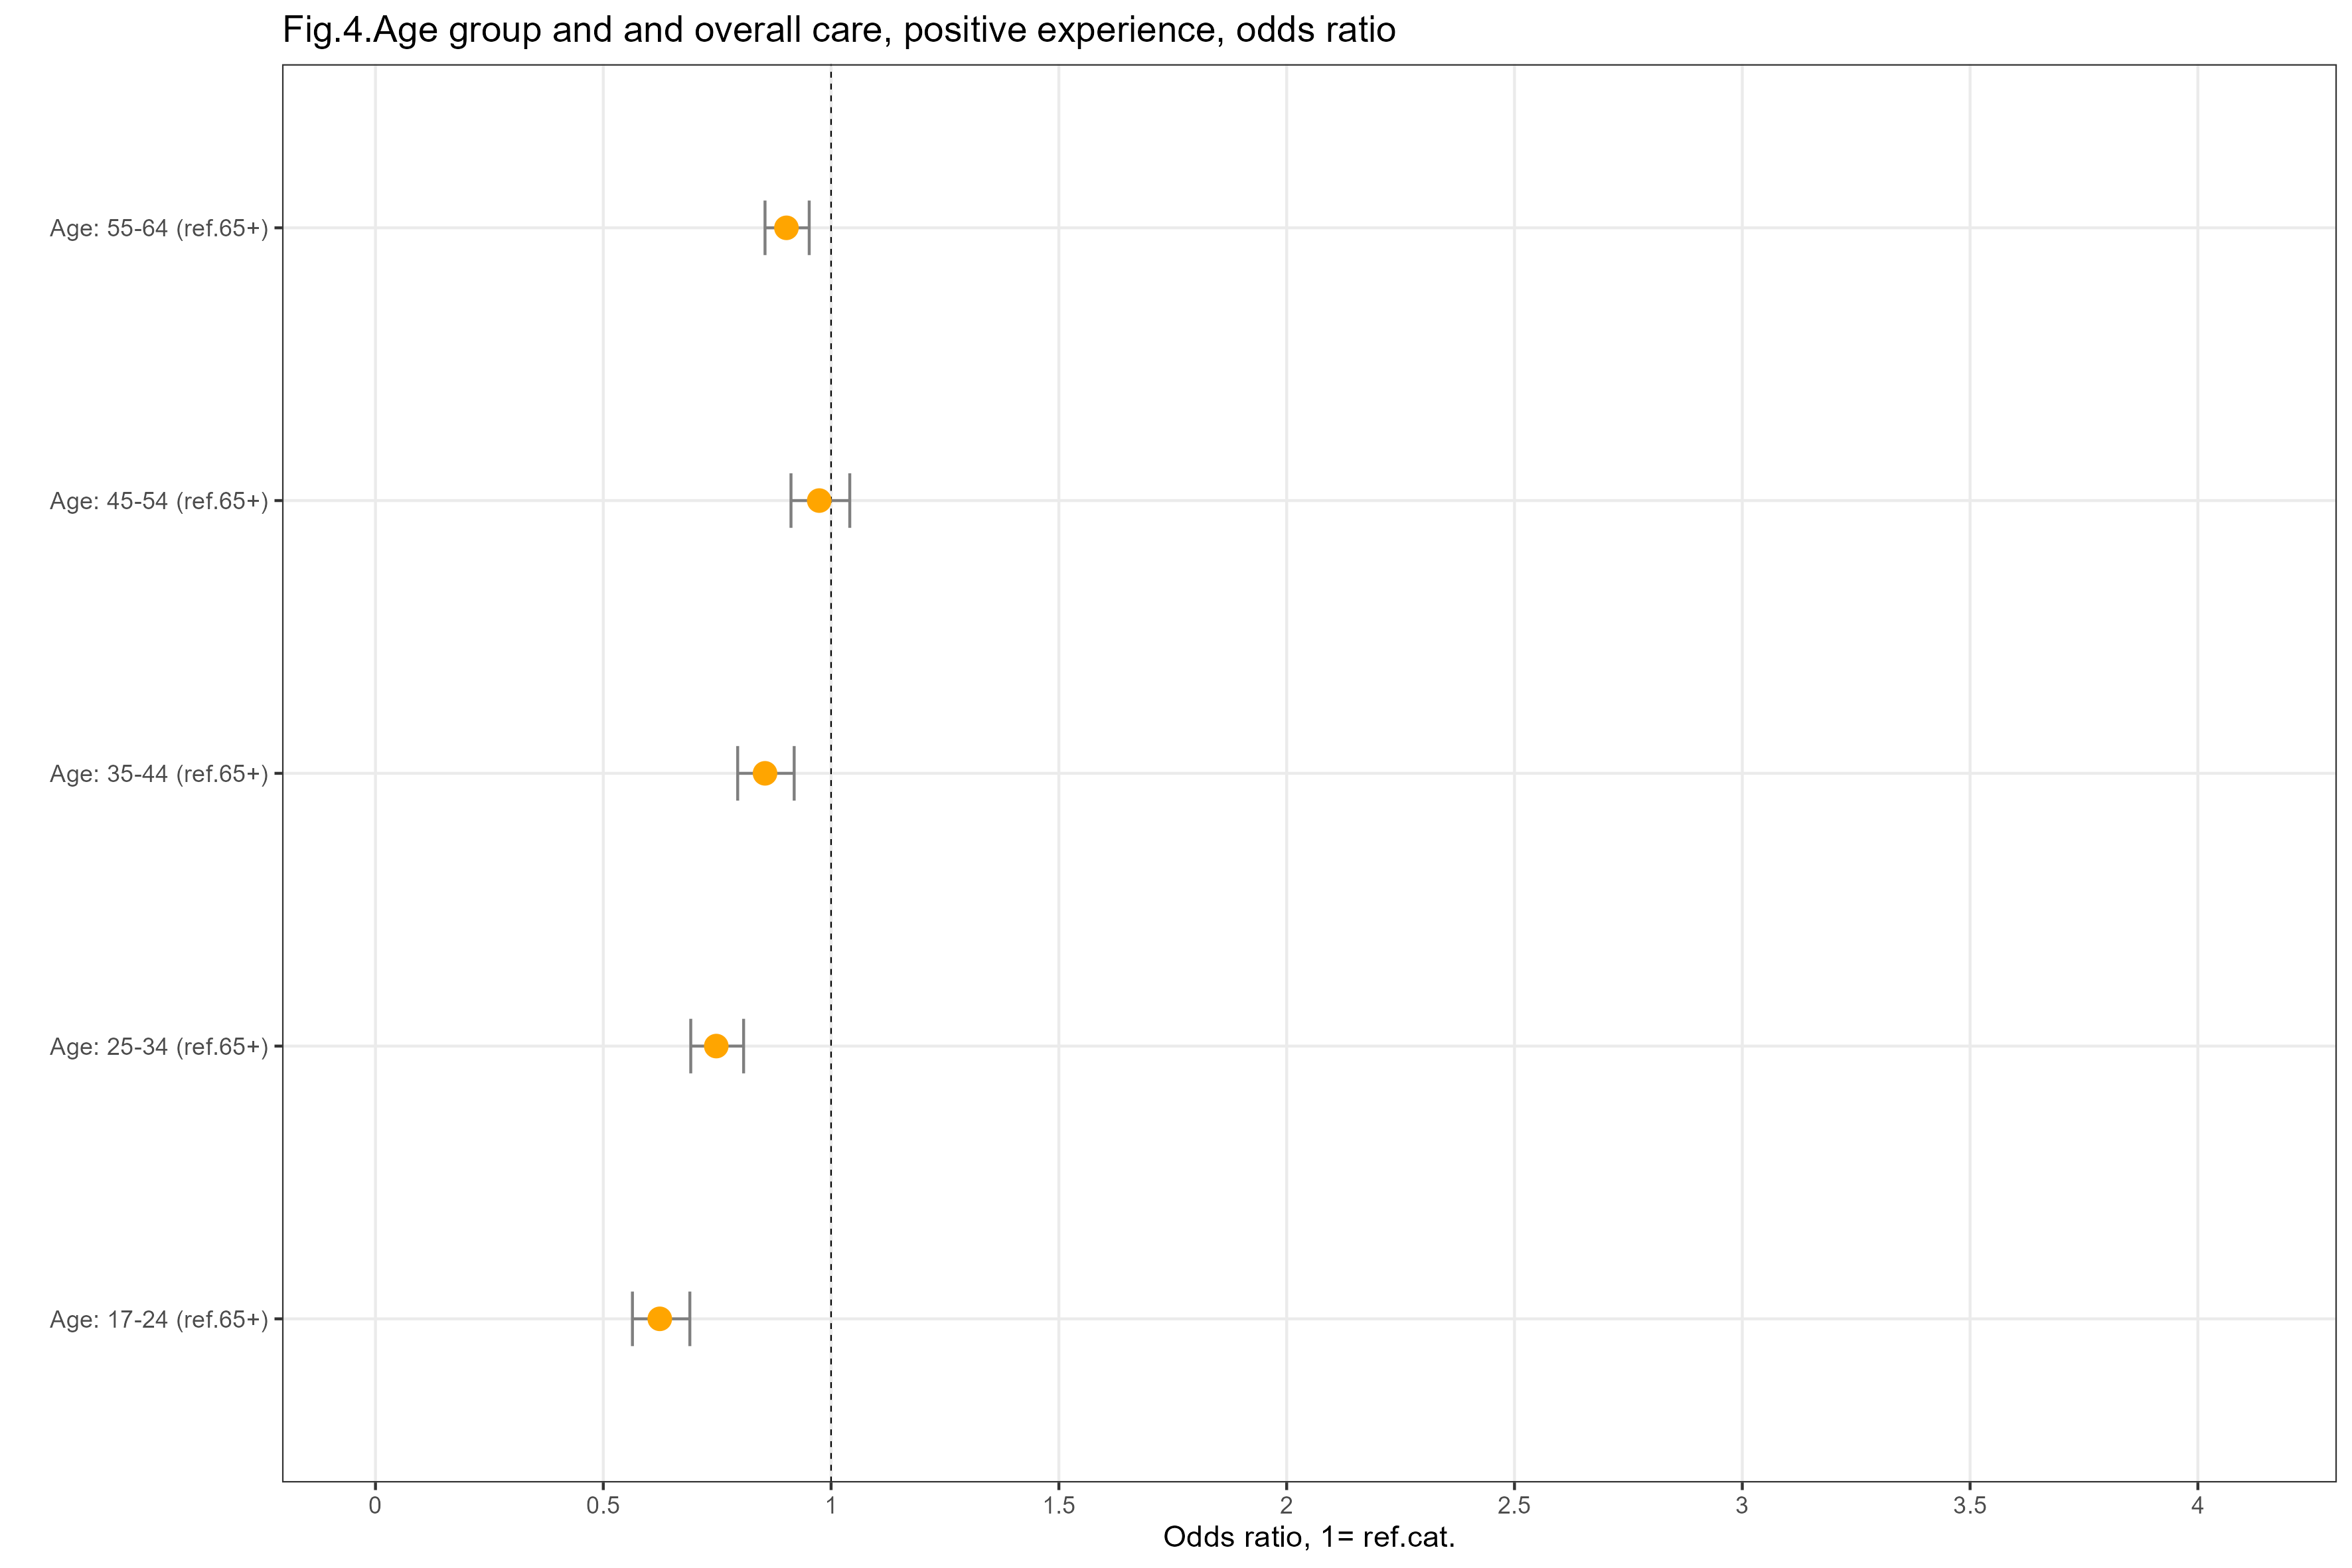
Age group
The age group is not asked in the questionnaire, but it is obtained by administrative records.
The reference group is people who are 65+.
younger people are less likely to rate overall care positively
the only exception is the group of people aged 45-54, that have a similar likelihood of rating positively overall care, compared with the reference group
The results (OR and confidence intervals) for this factor are shown in the graph below.
Impairment
Survey respondents could select more than one impairment (i.e. illness/condition, Q40 in the questionnaire).
The reference group is people who responded “none of the above”. This group may include people with no impairments, those with inactive fluctuating or progressive conditions, or those with one or more short-term impairments that do not fall into any of the other response options.
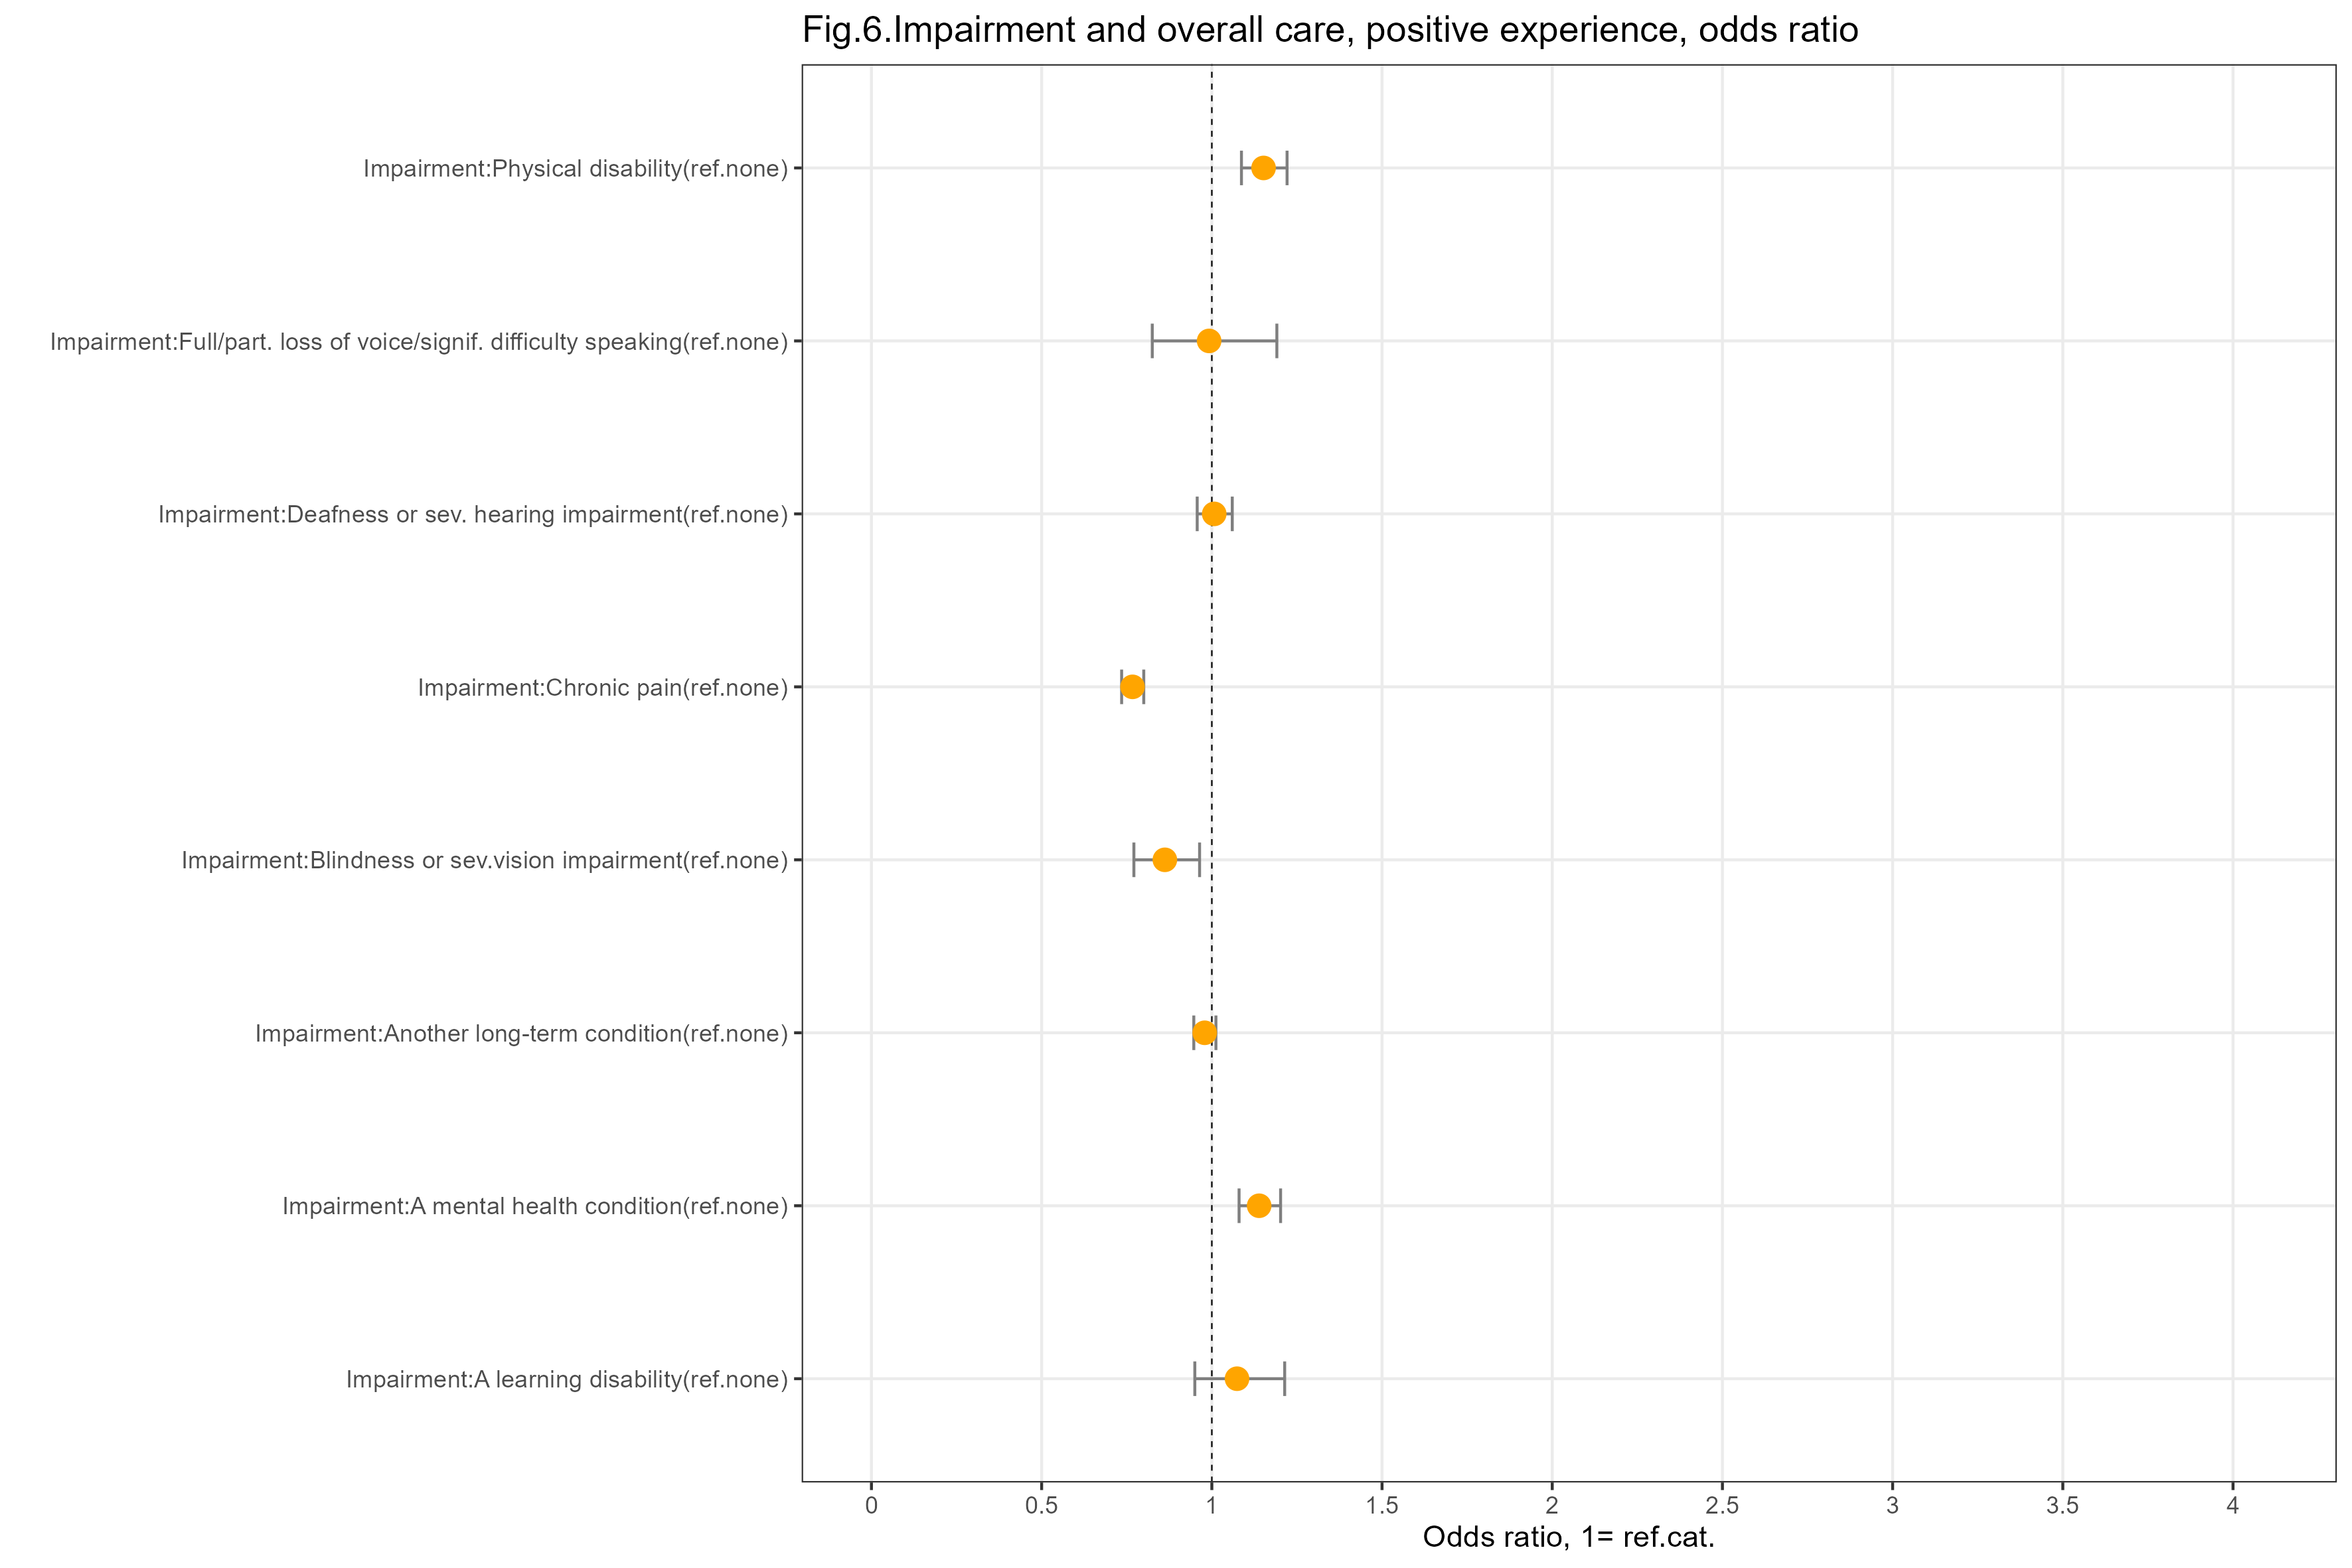
people answering “physical disability” and/or “a mental health condition” are slightly more likely to rate their overall care positively, compared with the reference group
people answering “chronic pain lasting at least 3 months” and/or “blindness or severe vision impairment” are less likely to rate overall care positively, compared with the reference group
people answering any other impairment (“deafness or severe hearing impairment”, “a learning disability”, “another long-term condition”, “full or partial loss of voice or significant difficulty speaking”) have a similar likelihood of rating positively overall care, compared with the reference group
The results (OR and confidence intervals) for this factor are shown in the graph below.
Activity limitation
Survey question (Q41): “Are your day-to-day activities limited because of a health problem or disability which has lasted, or is expected to last, at least 12 months? Include problems related to old age”.
The reference group is people who responded “no”.
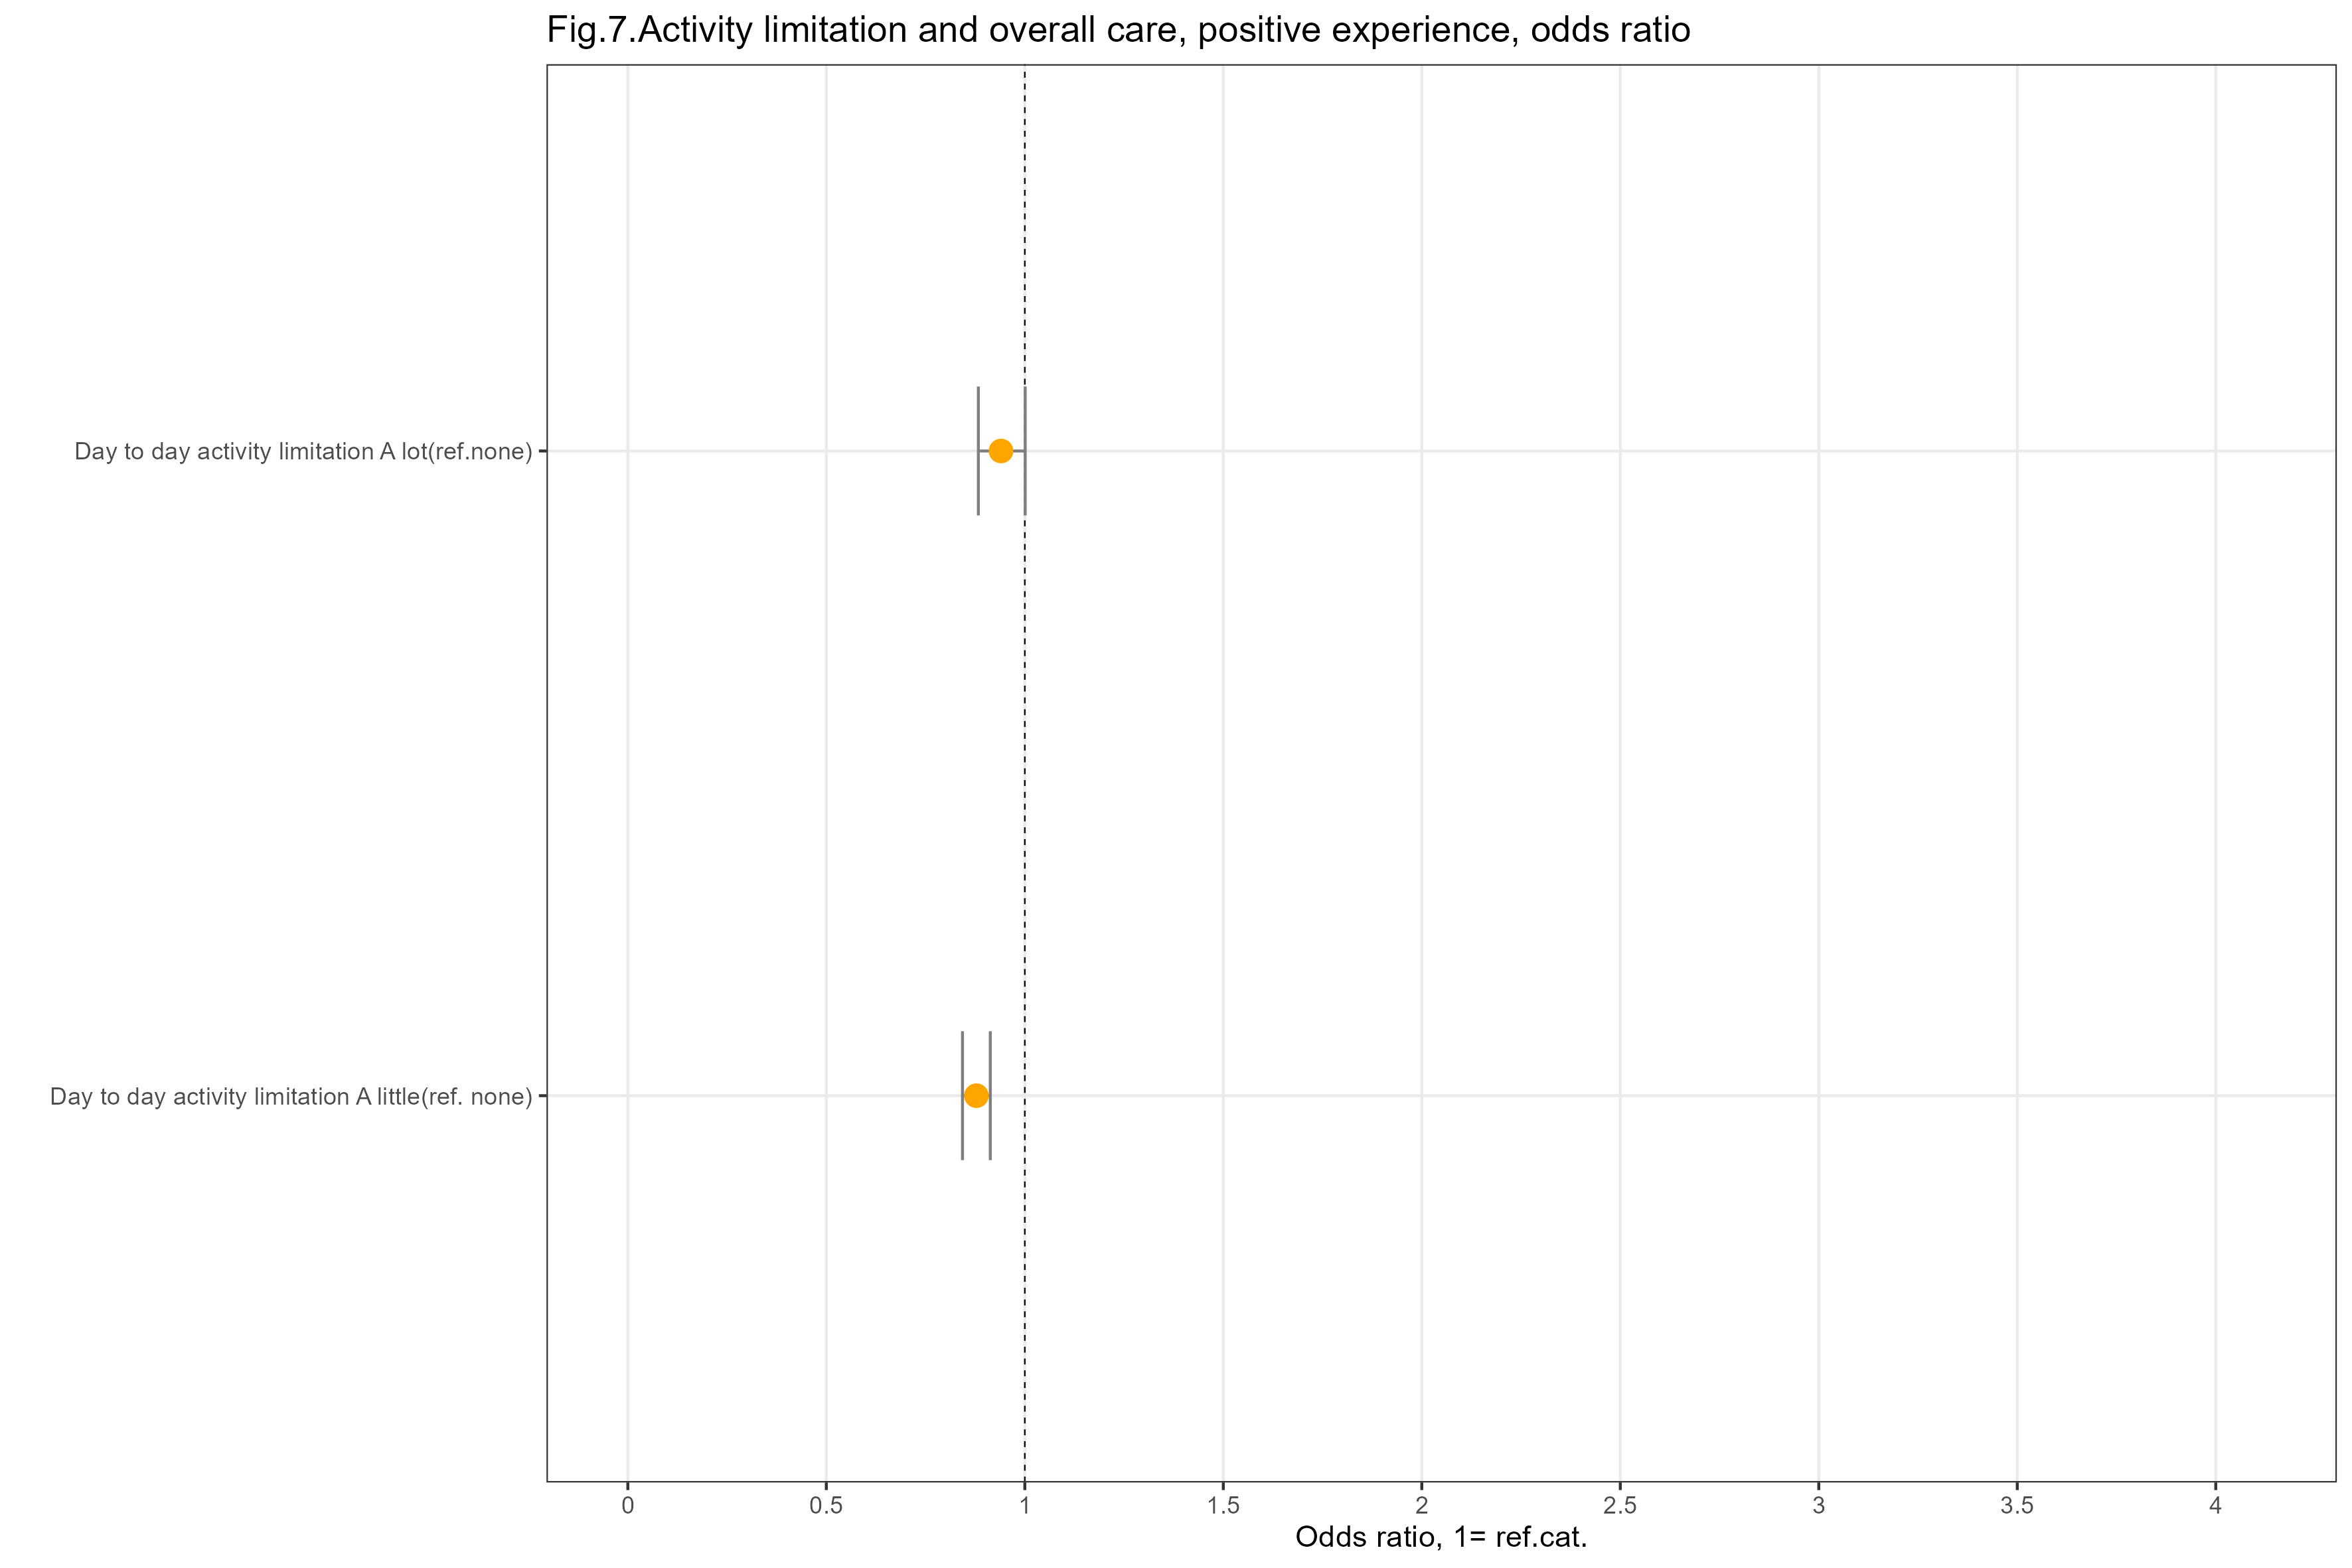
people responding “yes, limited a little”, are slightly less likely to rate overall care positively, compared with the reference group
people responding “yes, limited a lot” have a similar likelihood of rating overall care positively, compared with the reference group
The results (OR and confidence intervals) for this factor are shown in the graph below.
Religion
Survey question (Q46): “What religion, religious denomination or body do you belong to?”.
The reference group is people who responded “none”.
people responding “Muslim” are less likely to rate overall care positively, compared with the reference group
people responding “Roman Catholic” or “Other Christian” are less likely to rate overall care positively, compared with the reference group
people responding “Church of Scotland” or “All other religions” have a similar likelihood of rating overall care positively, compared with the reference group
“all other religions” includes the following response options: “Buddhist”, “Sikh”, “Jewish”, “Hindu”, “Pagan”, and “Another religion”
The results (OR and confidence intervals) for this factor are shown in the graph below.
Work status
Survey question (Q45): “What best describes your work status?”.
The reference group is people who responded “Retired”.
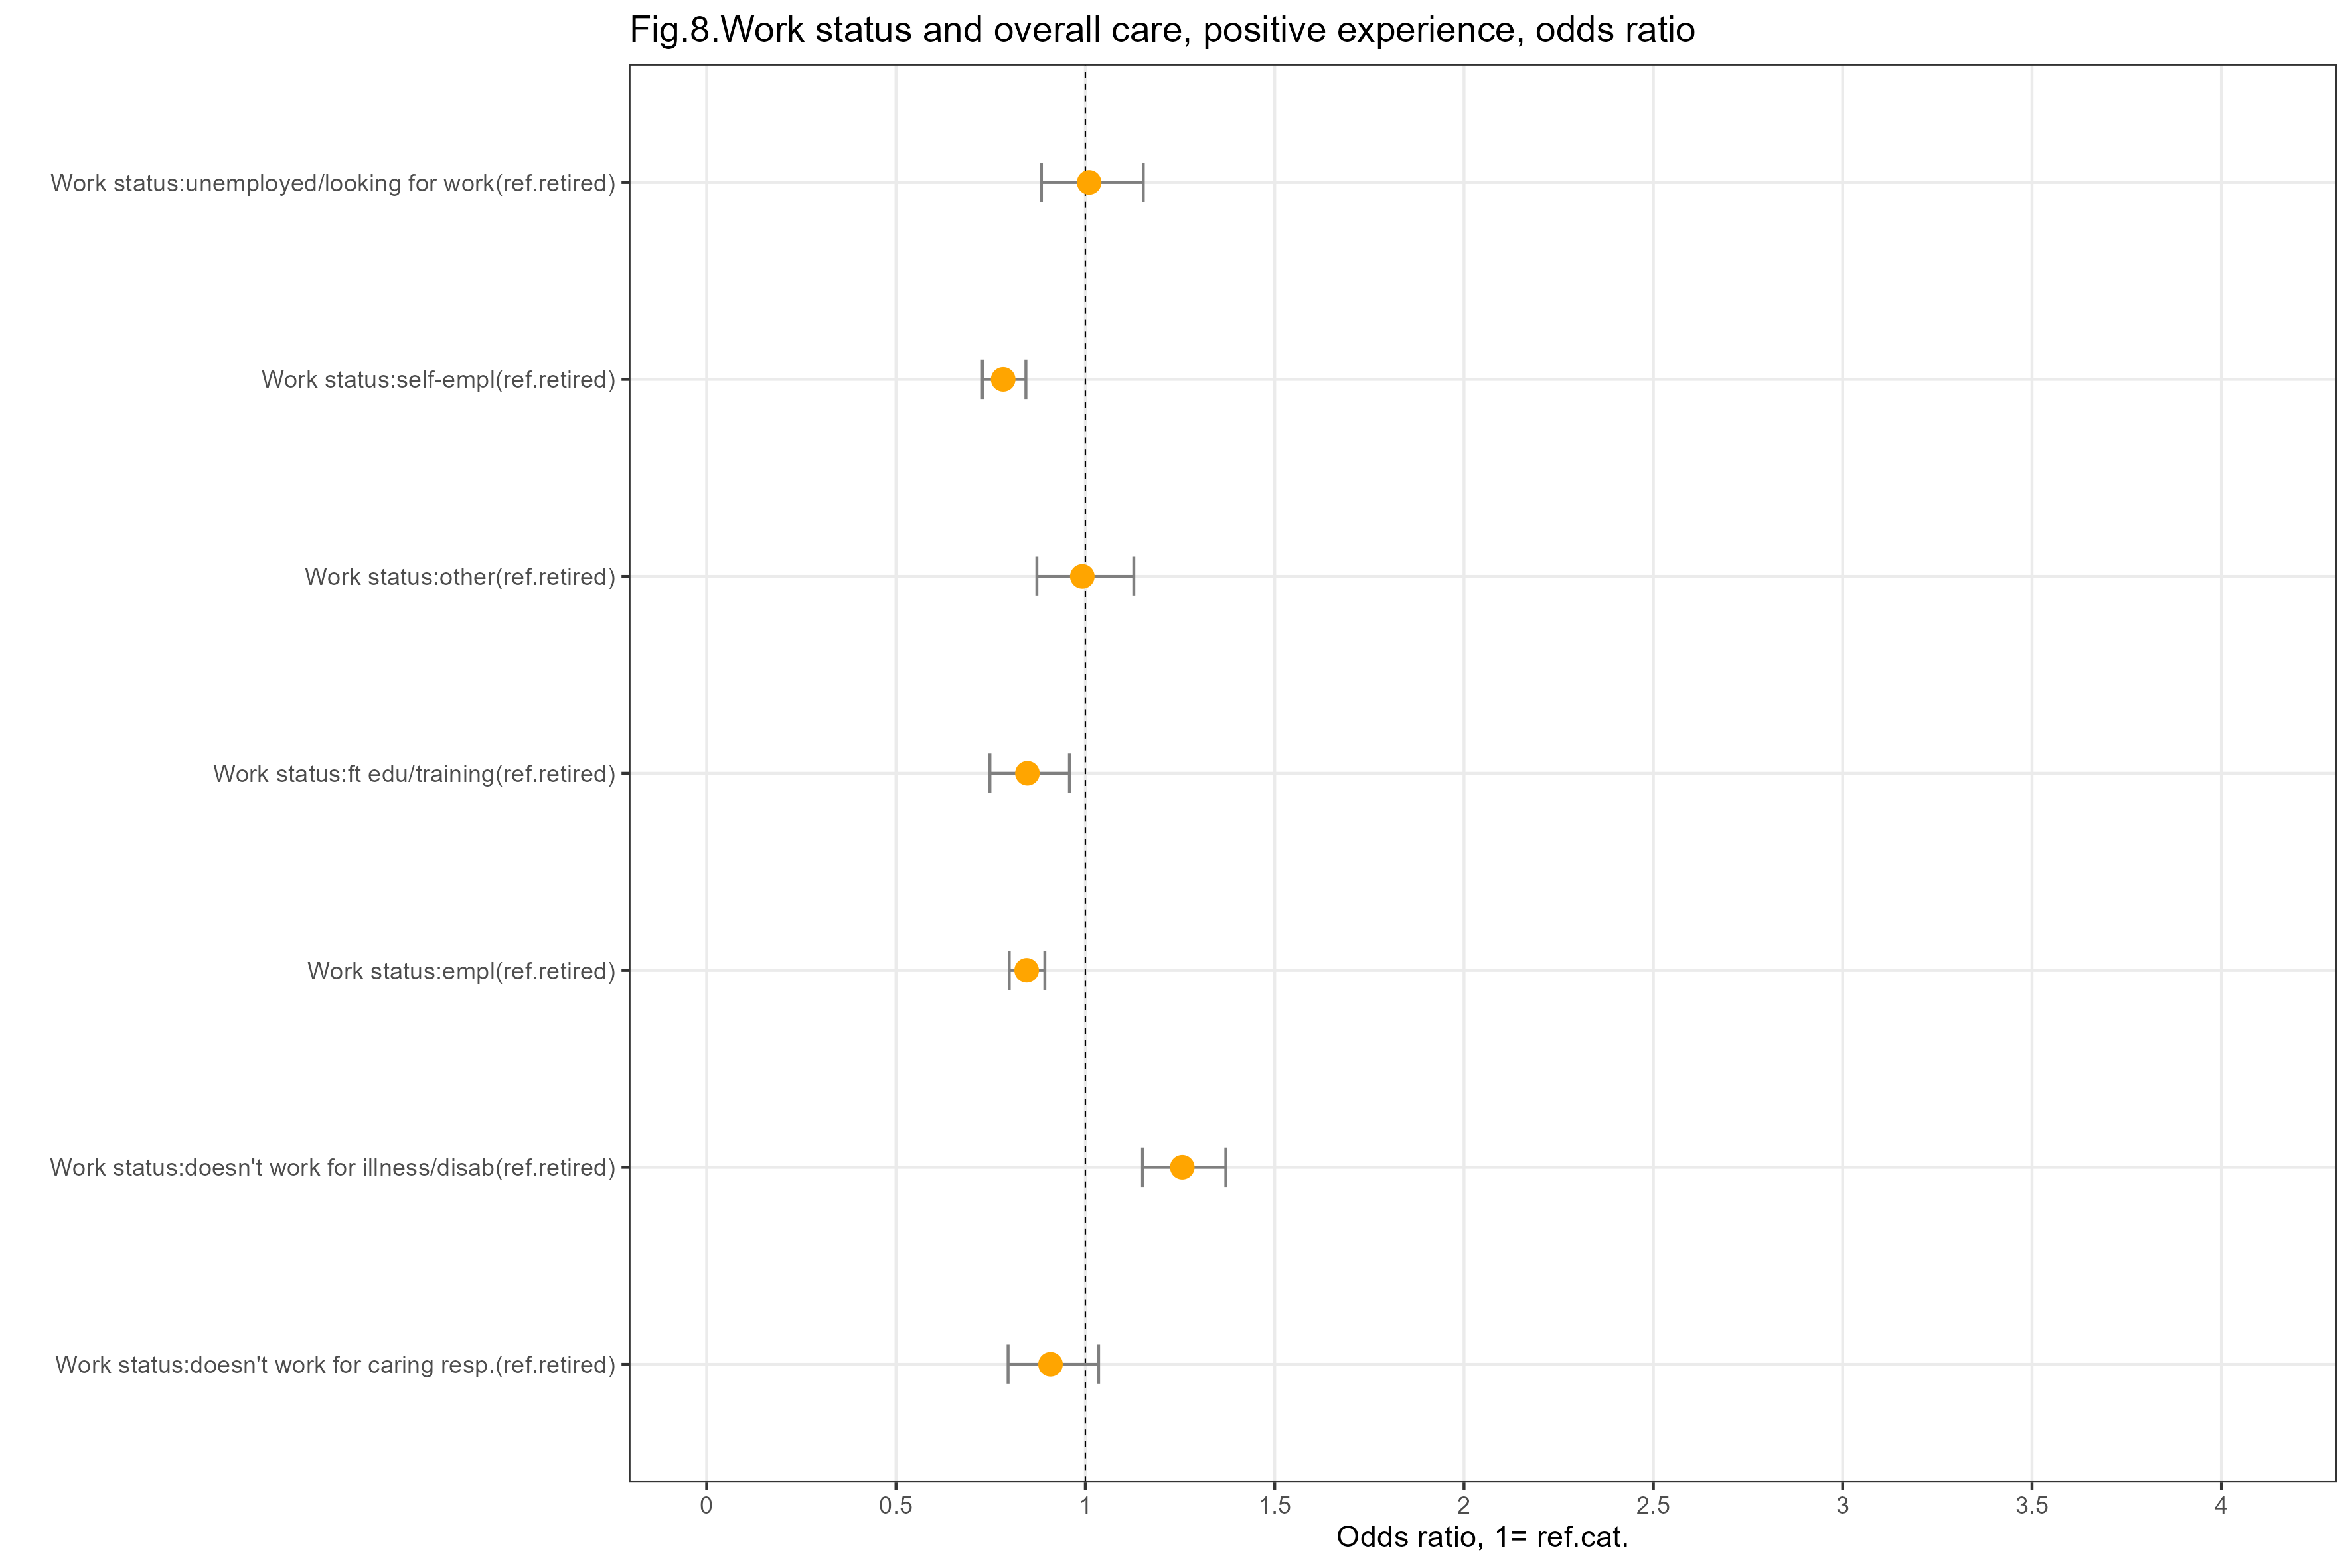
people responding that their work-status is “Employed (full or part time)”, “Self-employed (full or part time)” or “In full-time education or training” are less likely to rate overall care positively, compared with the reference group
people responding that their work-status is “Don’t work due to illness or disability” are more likely to rate overall care positively, compared with the reference group
people responding that their work-status is “Unemployed / looking for work”, “Don’t work due to caring responsibilities” or “Other” have a similar likelihood of rating overall care positively, compared with the reference group
The results (OR and confidence intervals) for this factor are shown in the graph below.
Context
General Practice list size
The list size is the number of registered patients per general practice.
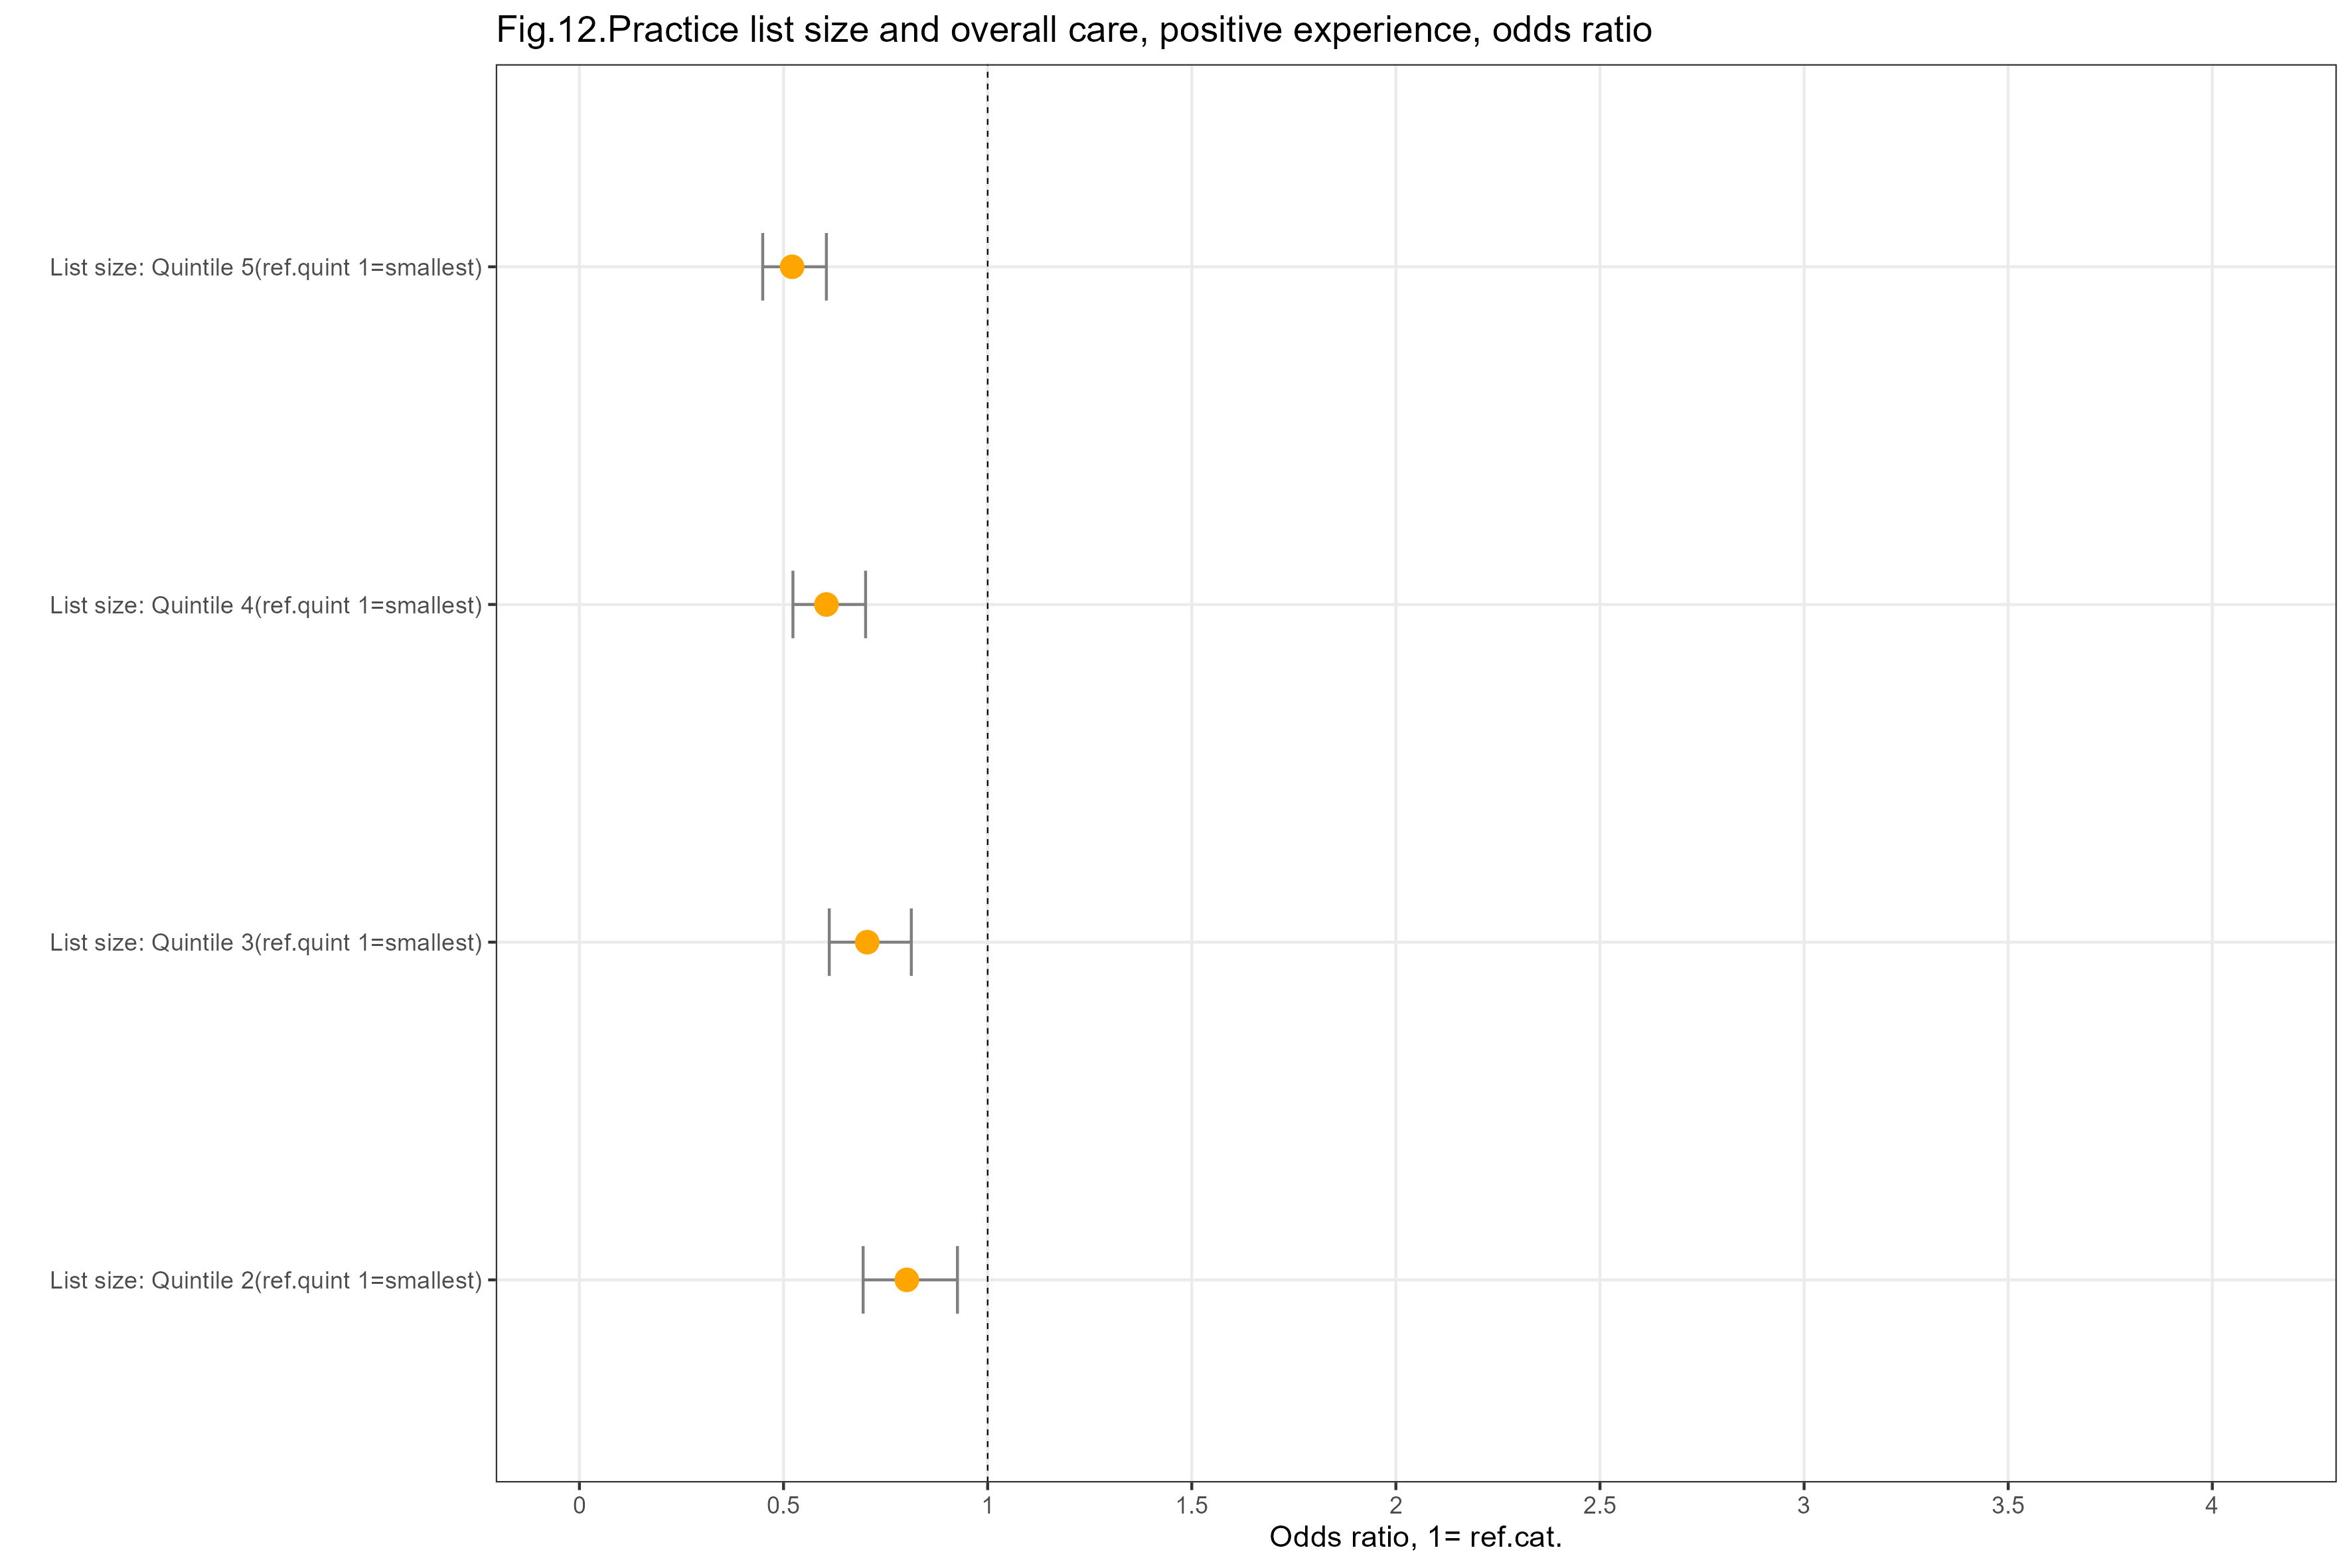
The lists are classified according to the quintiles, where the first quintile includes practices with the smallest number of registered patients and the fifth quintile practices with the largest.
The reference group is practice lists within the first quintile (the smallest list sizes).
- the larger the list sizes are, the less likely people are to rate overall care positively
The results (OR and confidence intervals) for this factor are shown in the graph below.
General Practices administered by the Health Board
General practices can be run directly by the NHS board (as opposed to being run by GP contractors).
The reference group is practices that are not run directly by the NHS board.
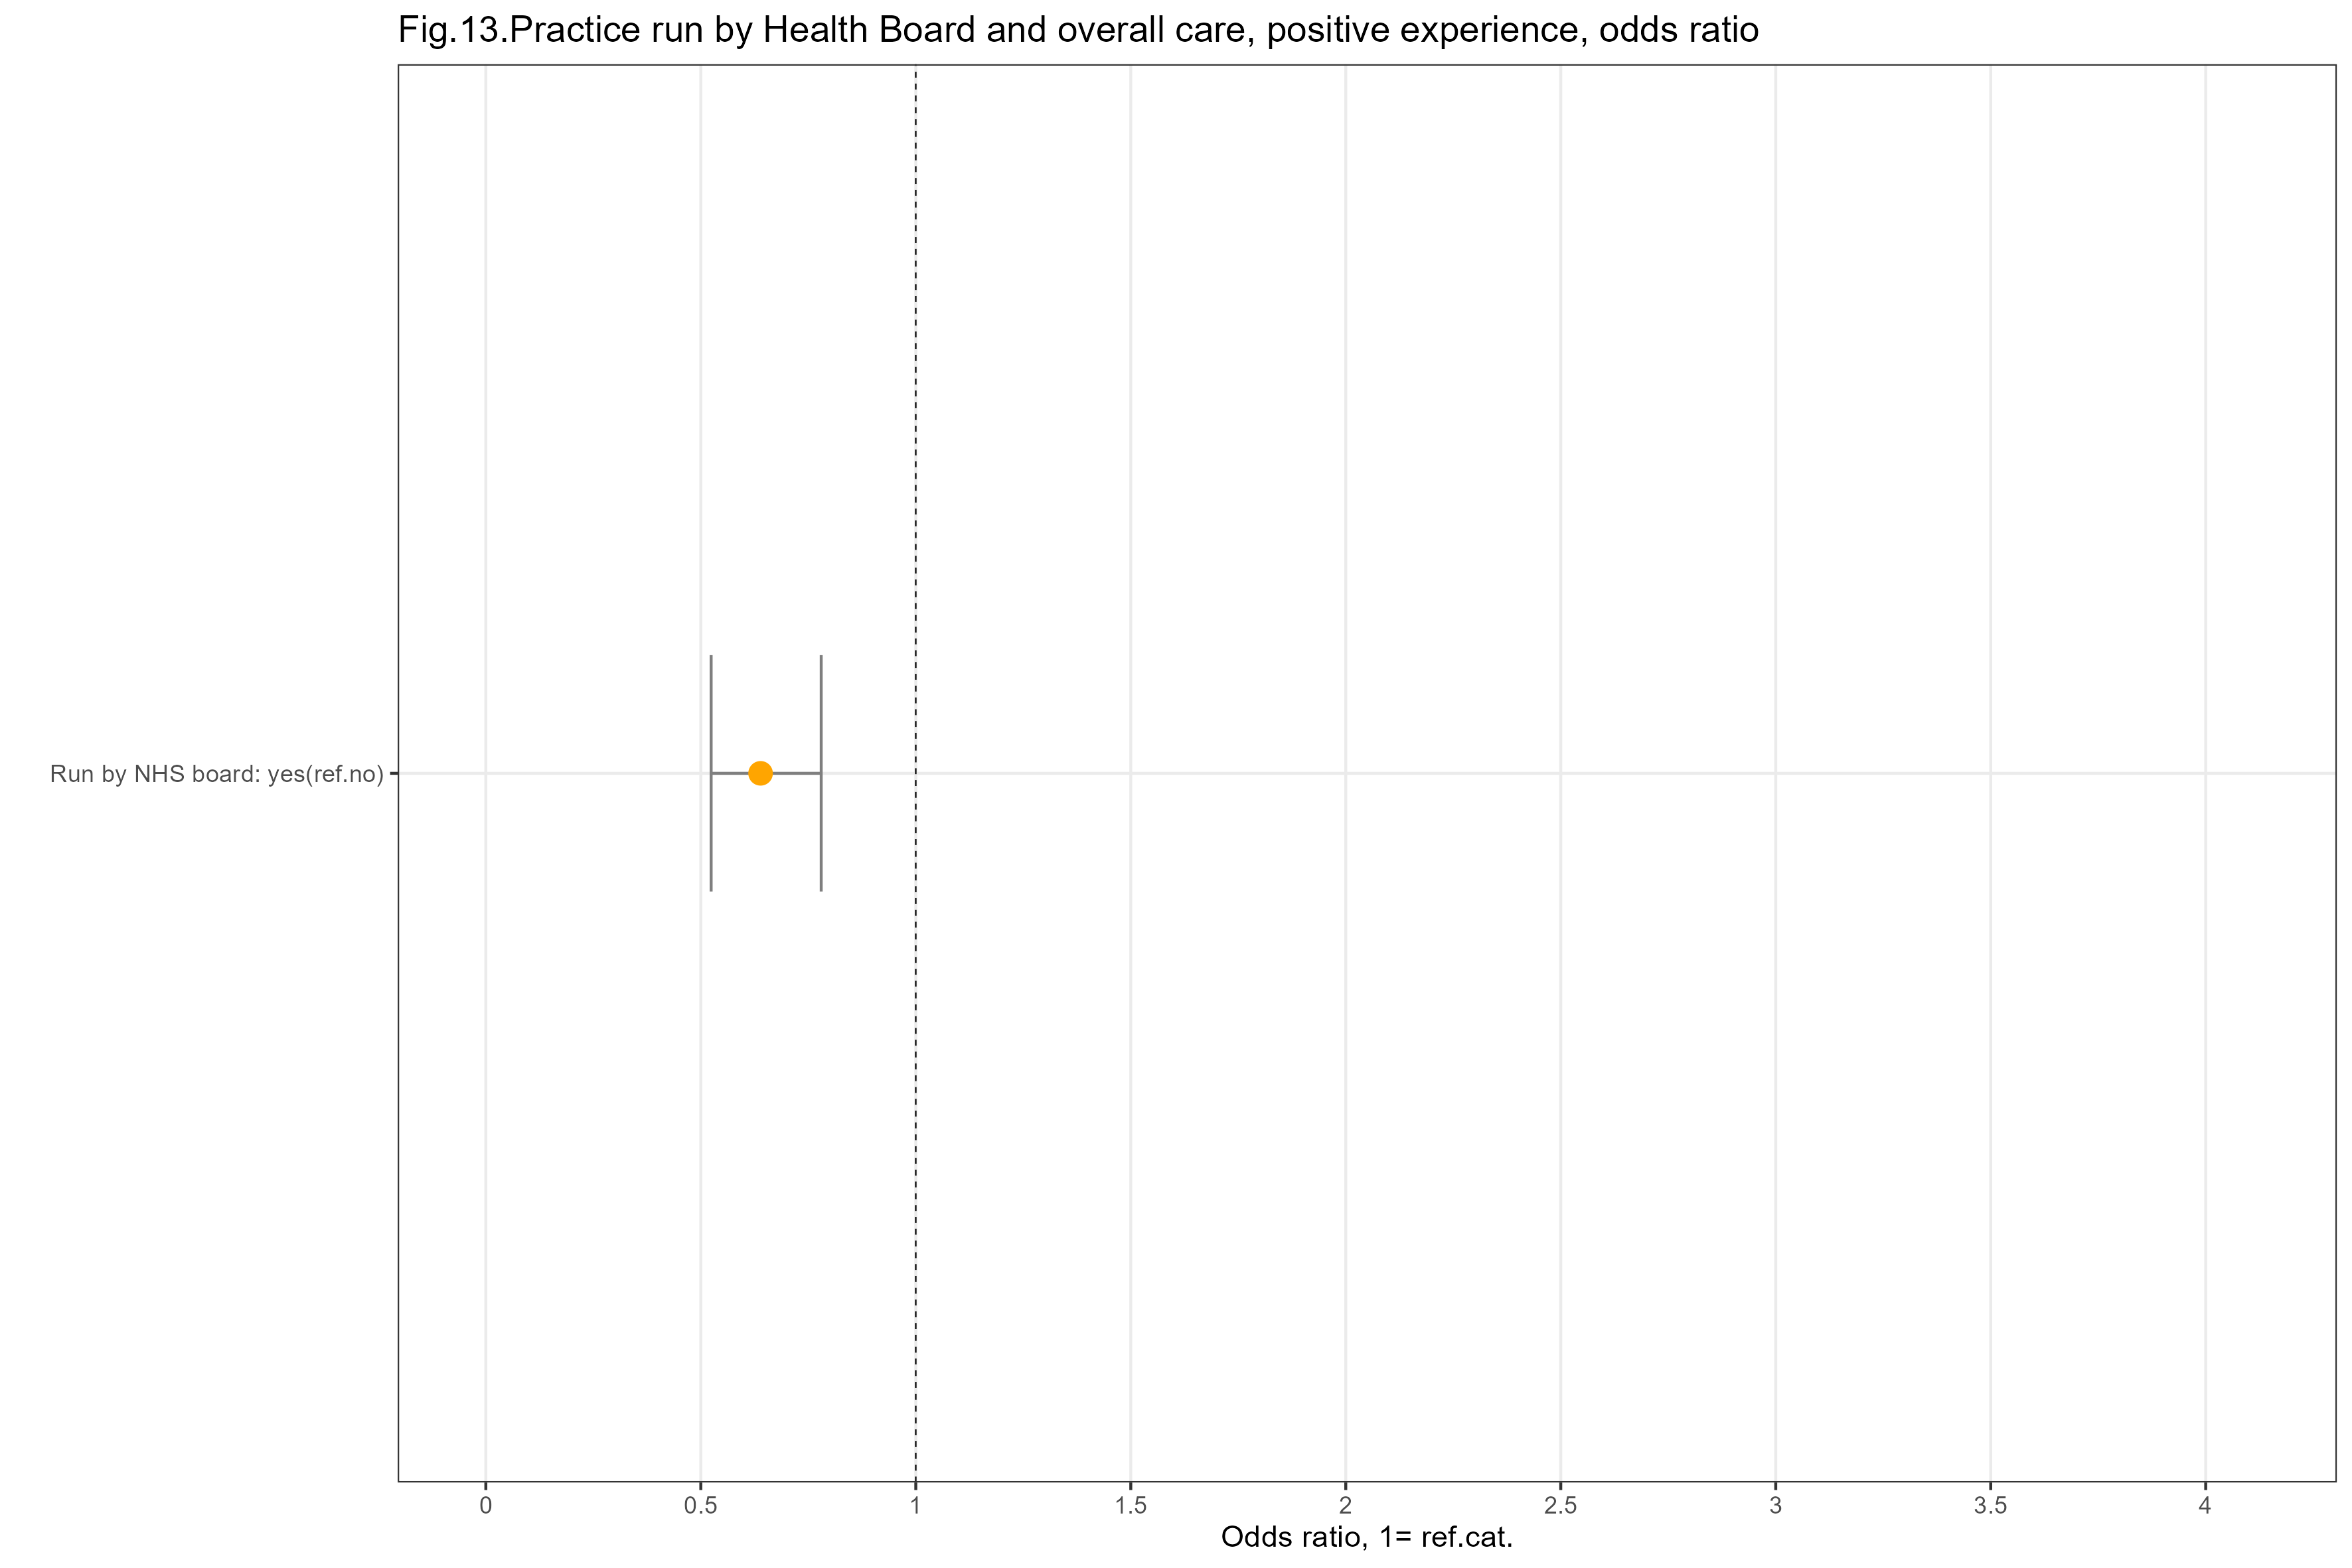
- people registered with general practices directly run by the health board are less likely to rate overall care positively, compared with the reference group
In order to interpret this result, we should keep in mind that health boards can directly run practices for different reasons. Sometimes, for example, the GP partners have got into difficulties or had to give up their contract at short notice. Consequently, people registered with these practices may be less likely to have a positive care experience due to reasons that are not linked to how well NHS board run the practice, but that are linked to issues existing before board management. More details about these practices would be needed to analyse these issues in depth. This is, however, out of the scope for this analysis.
The results (OR and confidence intervals) for this factor are shown in the graph below.
Dispensing General Practices
Dispensing practices can dispense medicines to their patients. Dispensing practices are more commonly found in remote, island and rural areas where there are no independent community pharmacies.
This information is obtained by administrative data and refers to the general practice the survey respondent is registered with.
The reference group is practices that that do not dispense medicines.
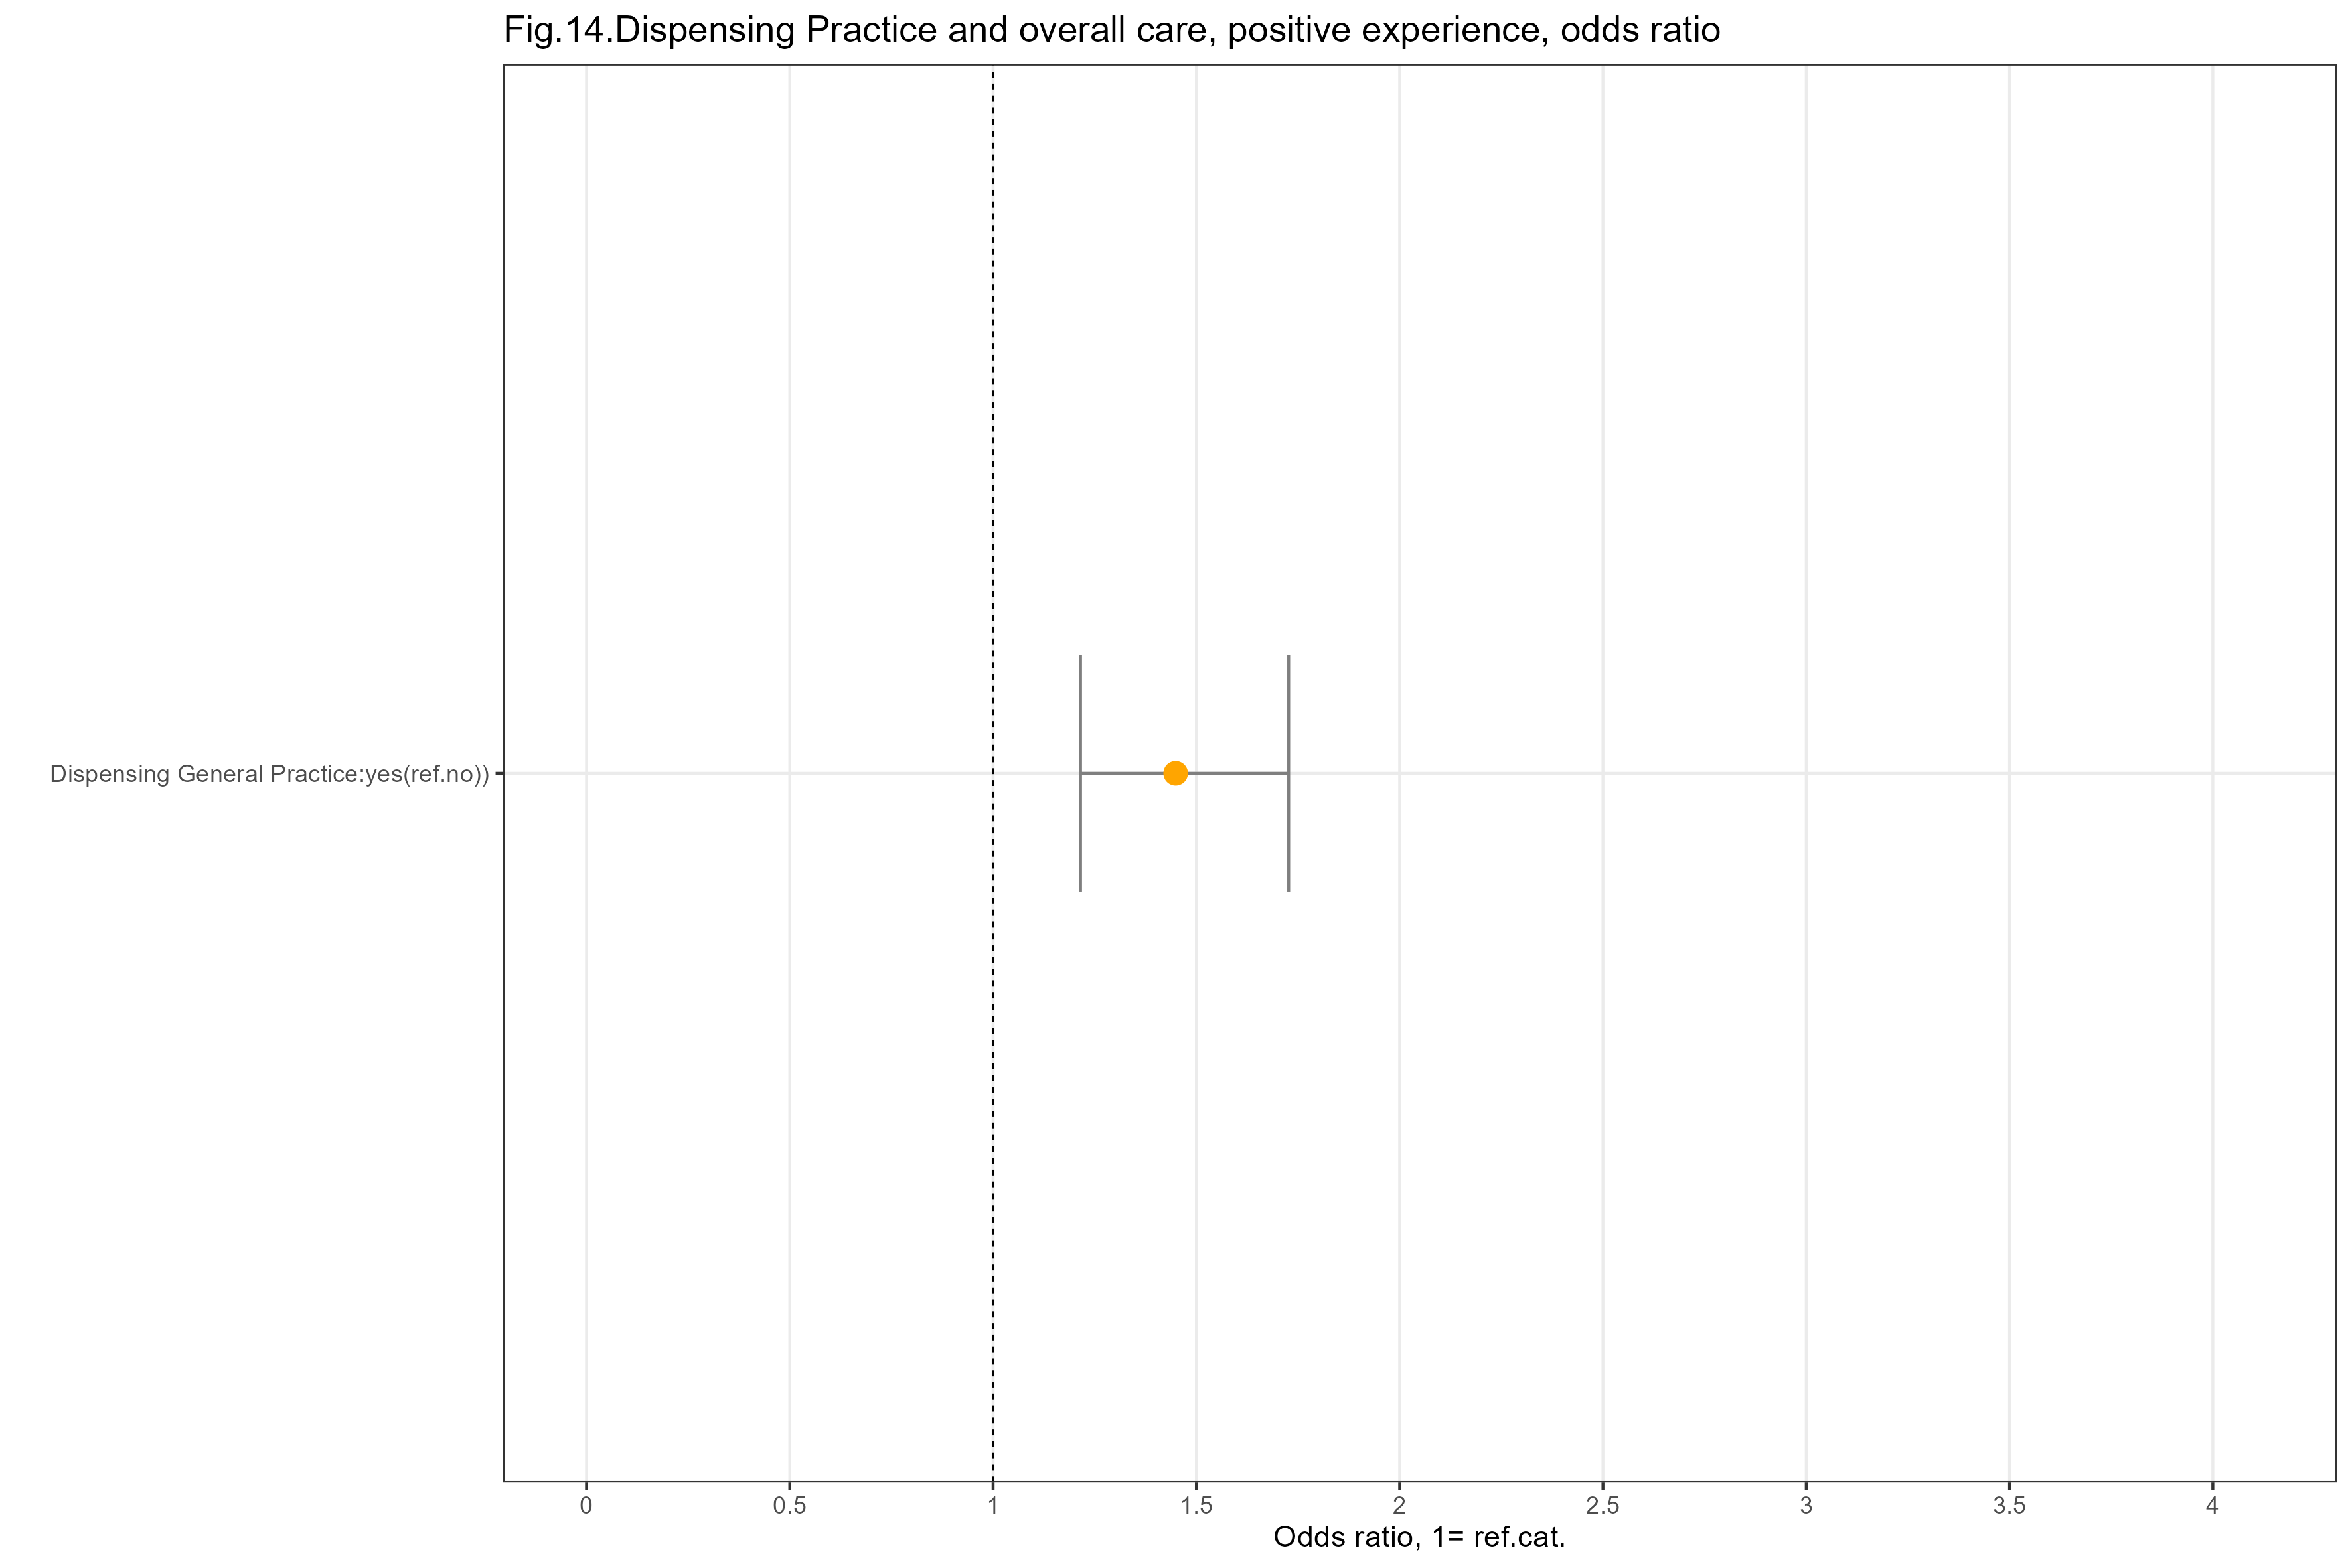
- people registered with general practices dispensing medicines are more likely to rate overall care positively, compared with the reference group
The results (OR and confidence intervals) for this factor are shown in the graph below.
Urban/rural classification
This information describes how urban or rural the place of residence of survey respondents is, according to the Scottish Government Urban Rural Classification 2016. This classification takes into account the settlement size and how long it takes to drive to an urban area.
The reference group is people who live in large urban areas.
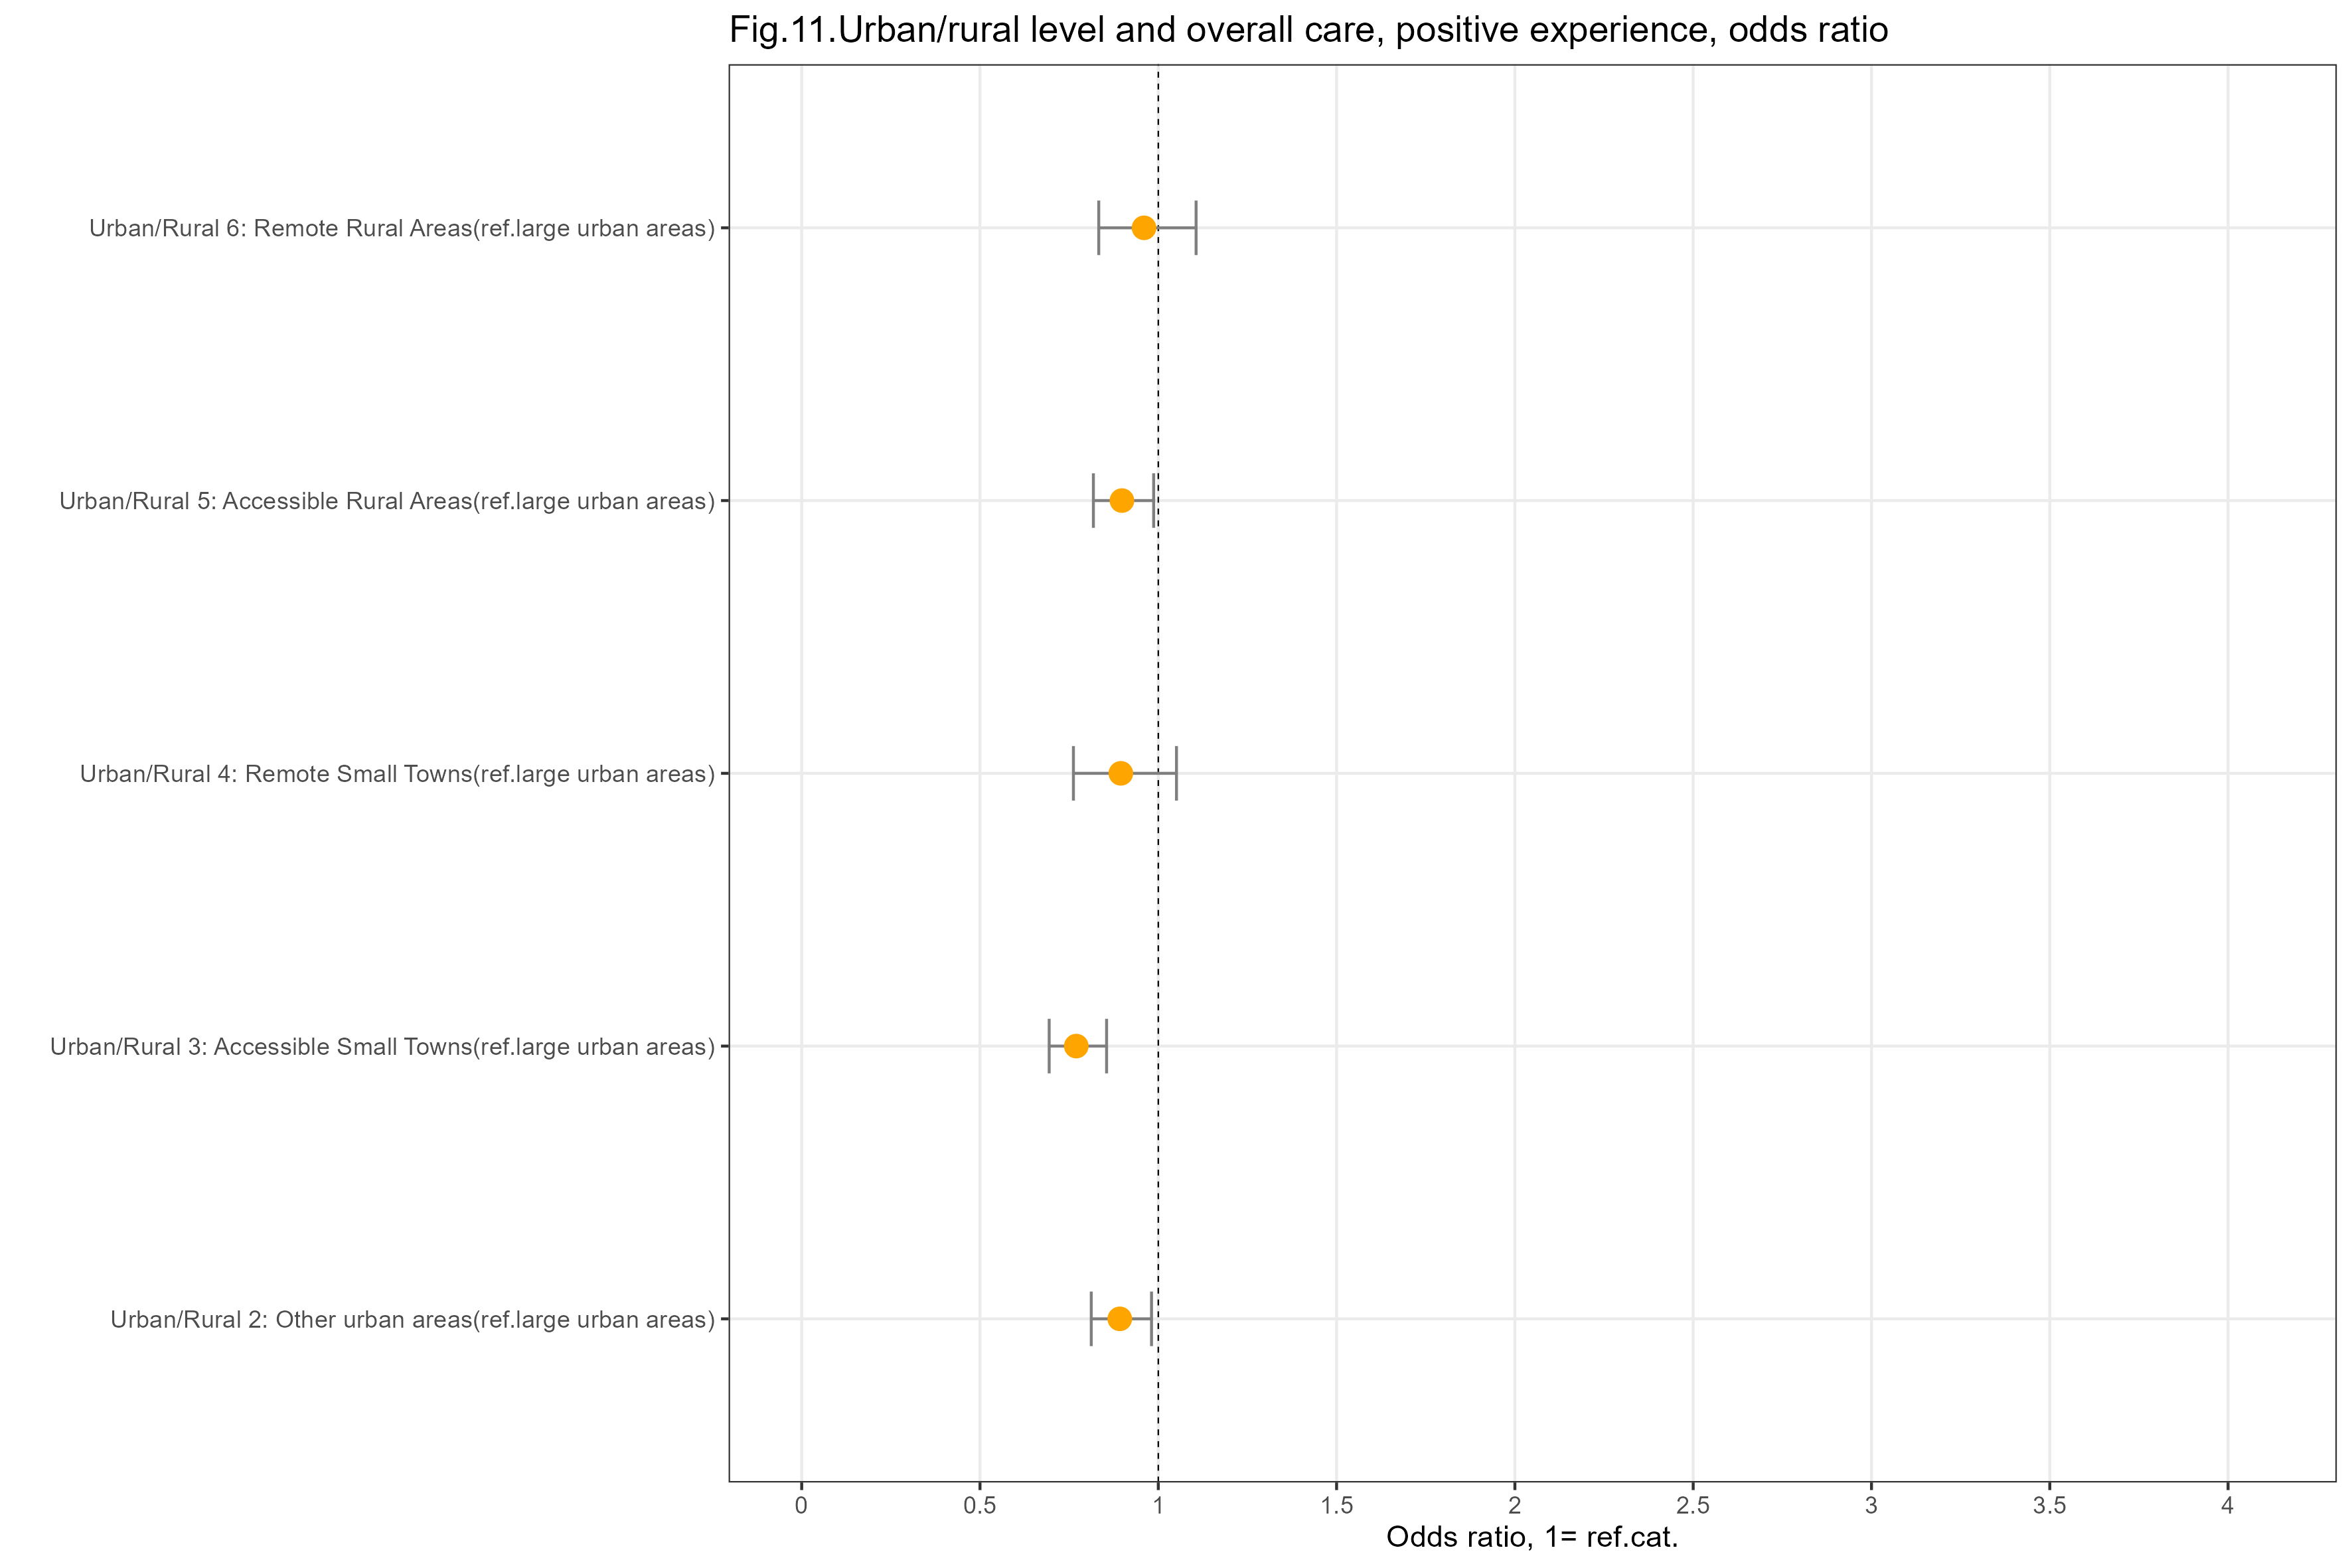
people living in accessible small towns, accessible rural areas, and other urban areas are slightly less likely to rate overall care positively, compared with the reference group
people living in remote small towns and remote rural areas have a similar likelihood of rating overall care positively, compared with the reference group
The results (OR and confidence intervals) for this factor are shown in the graph below.
Deprivation level (SIMD)
This information describes how deprived the place of residence of the survey respondents is, according to the Scottish Index of Multiple Deprivation 2020 (SIMD).
It is measured in quintiles, where the first quintile includes the most deprived areas while the fifth includes the least deprived.
The index is a relative measure of deprivation across small areas, and it looks at the extent to which an area is deprived across seven domains: income, employment, education, health, access to services, crime and housing. If an area is identified as ‘deprived’, this can relate to people having a low income but it can also mean fewer resources or opportunities.
The reference group is people who live in areas in the third SIMD quintile, that is in between the most and the least deprived areas.
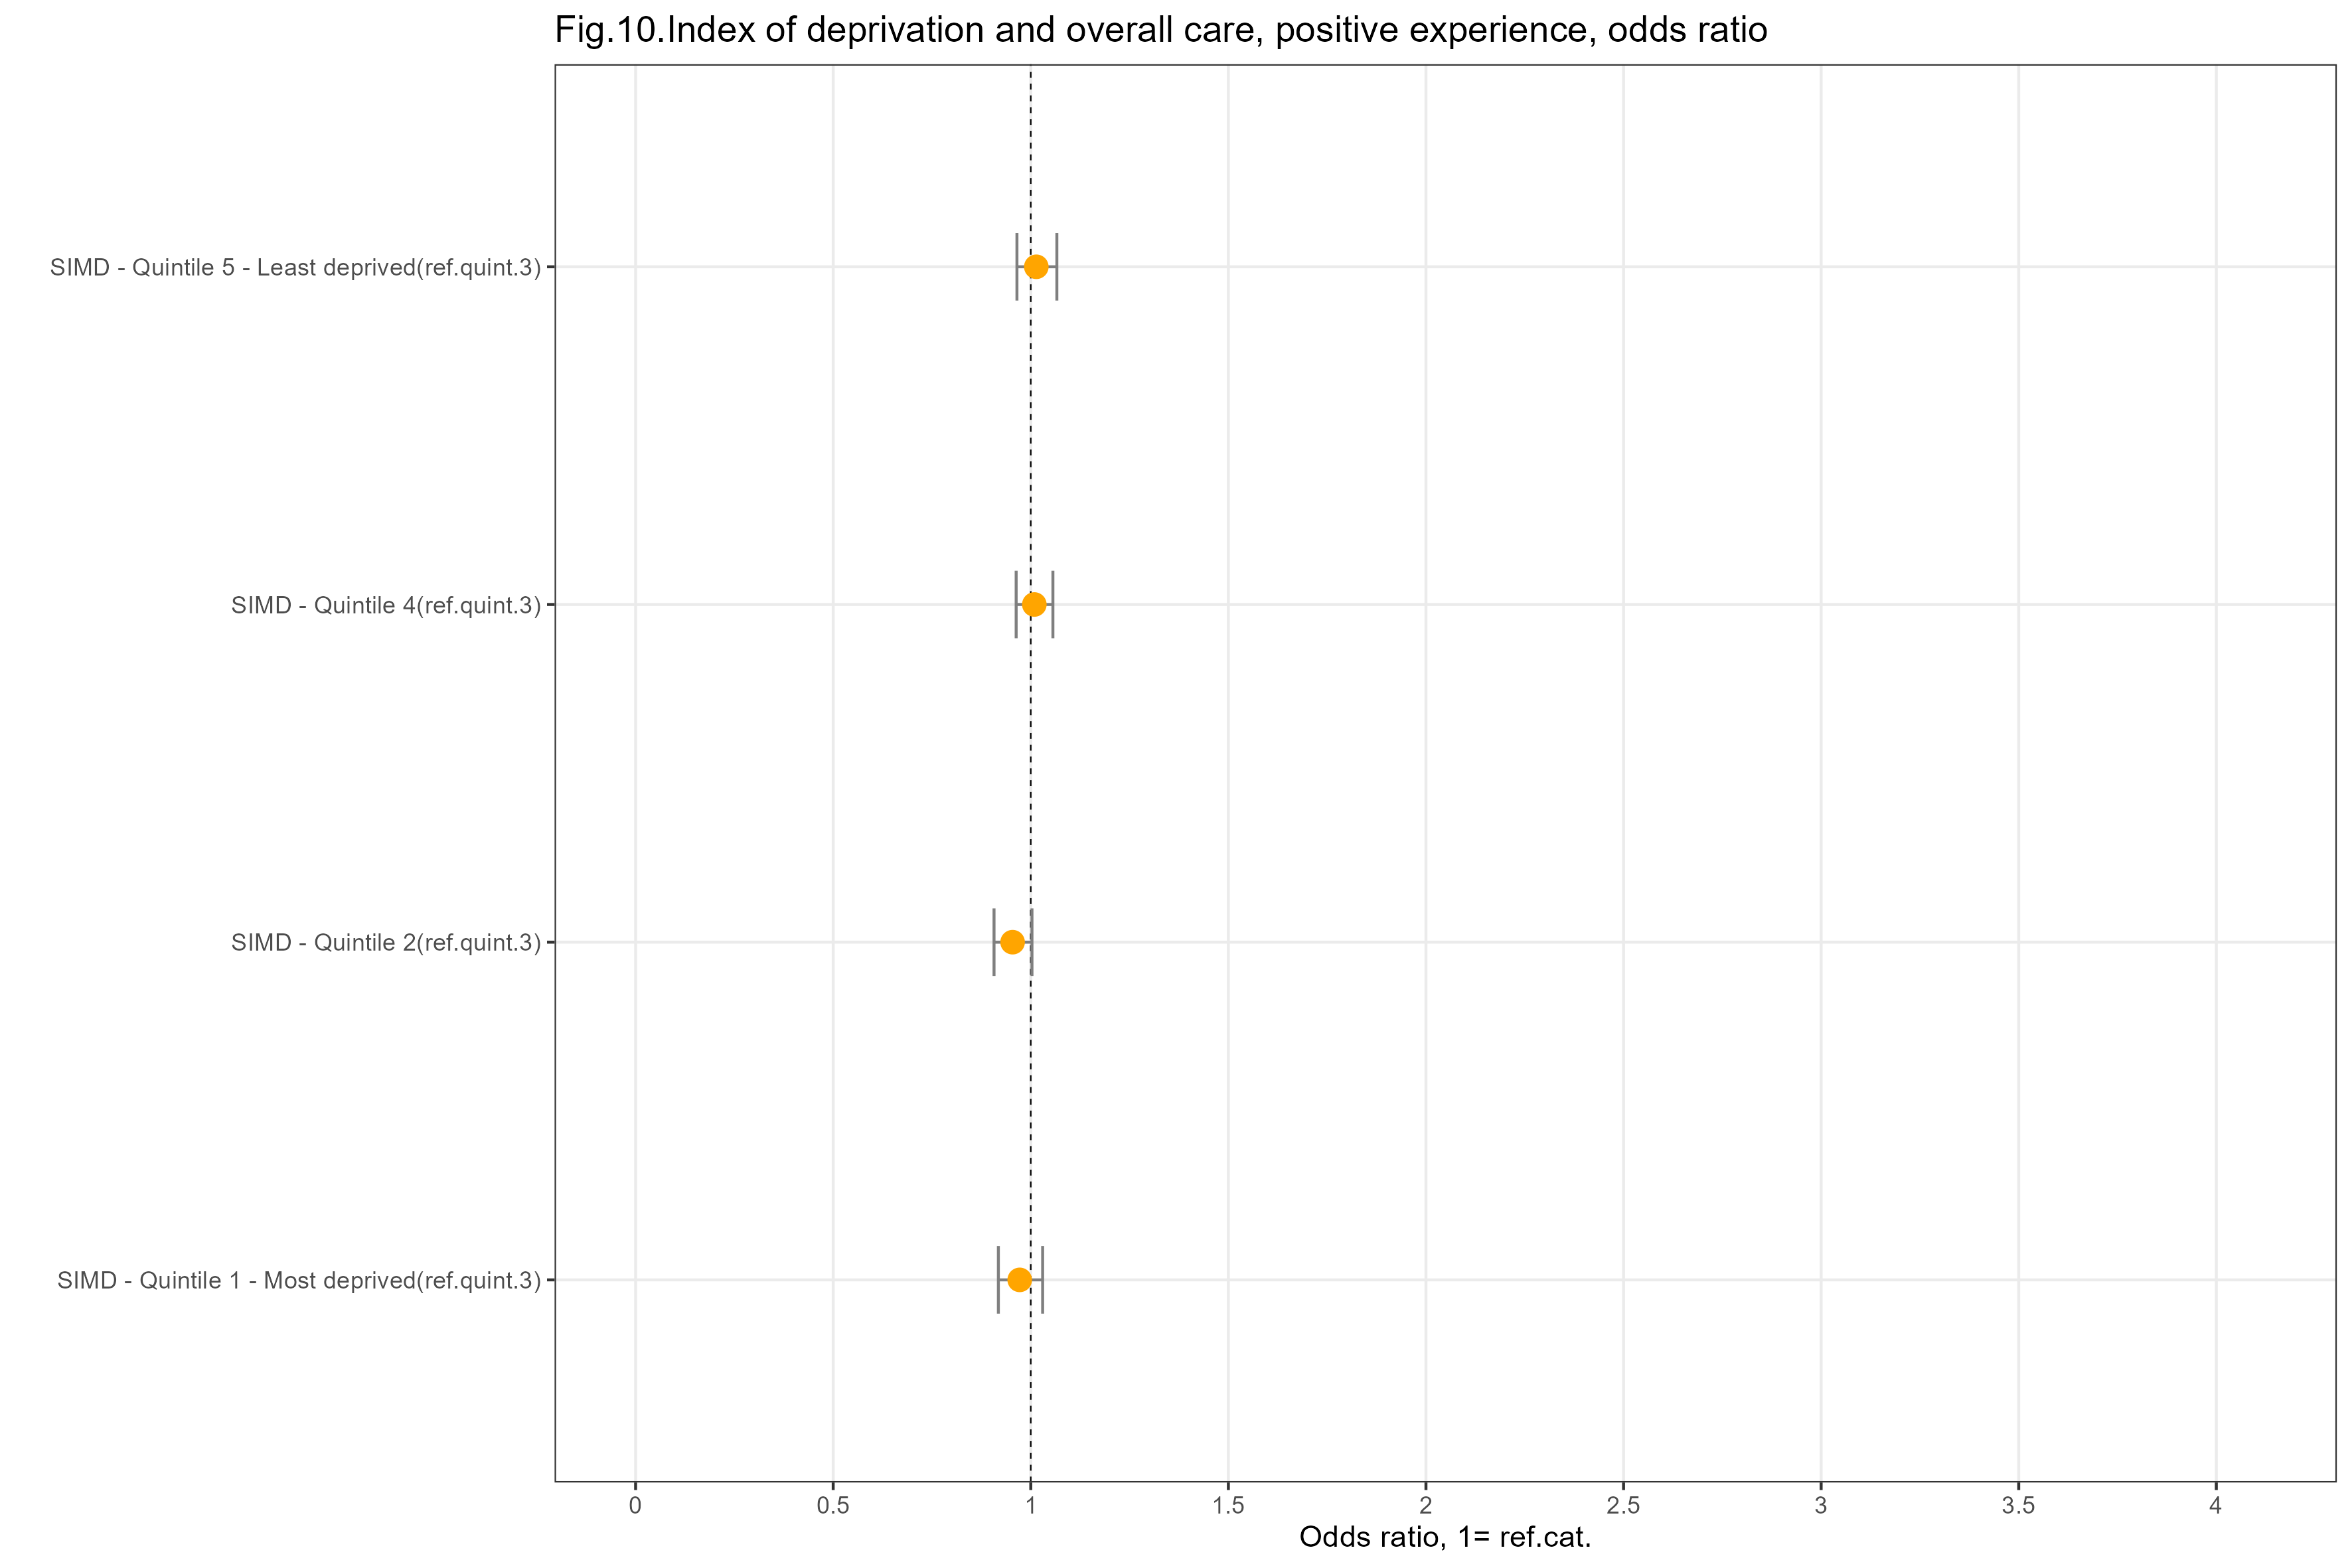
- people living in areas with different levels of deprivation have a similar likelihood of rating positively their overall care and therefore SIMD is not to linked to the likelihood of rating overall care positively when all other factors are considered
The results (OR and confidence intervals) for this factor are shown in the graph below.
Consultation with the healthcare professional
Frequency of contact with the general practice
Survey question (Q2): “Roughly, how often have you contacted this GP practice in the last 12 months?”.
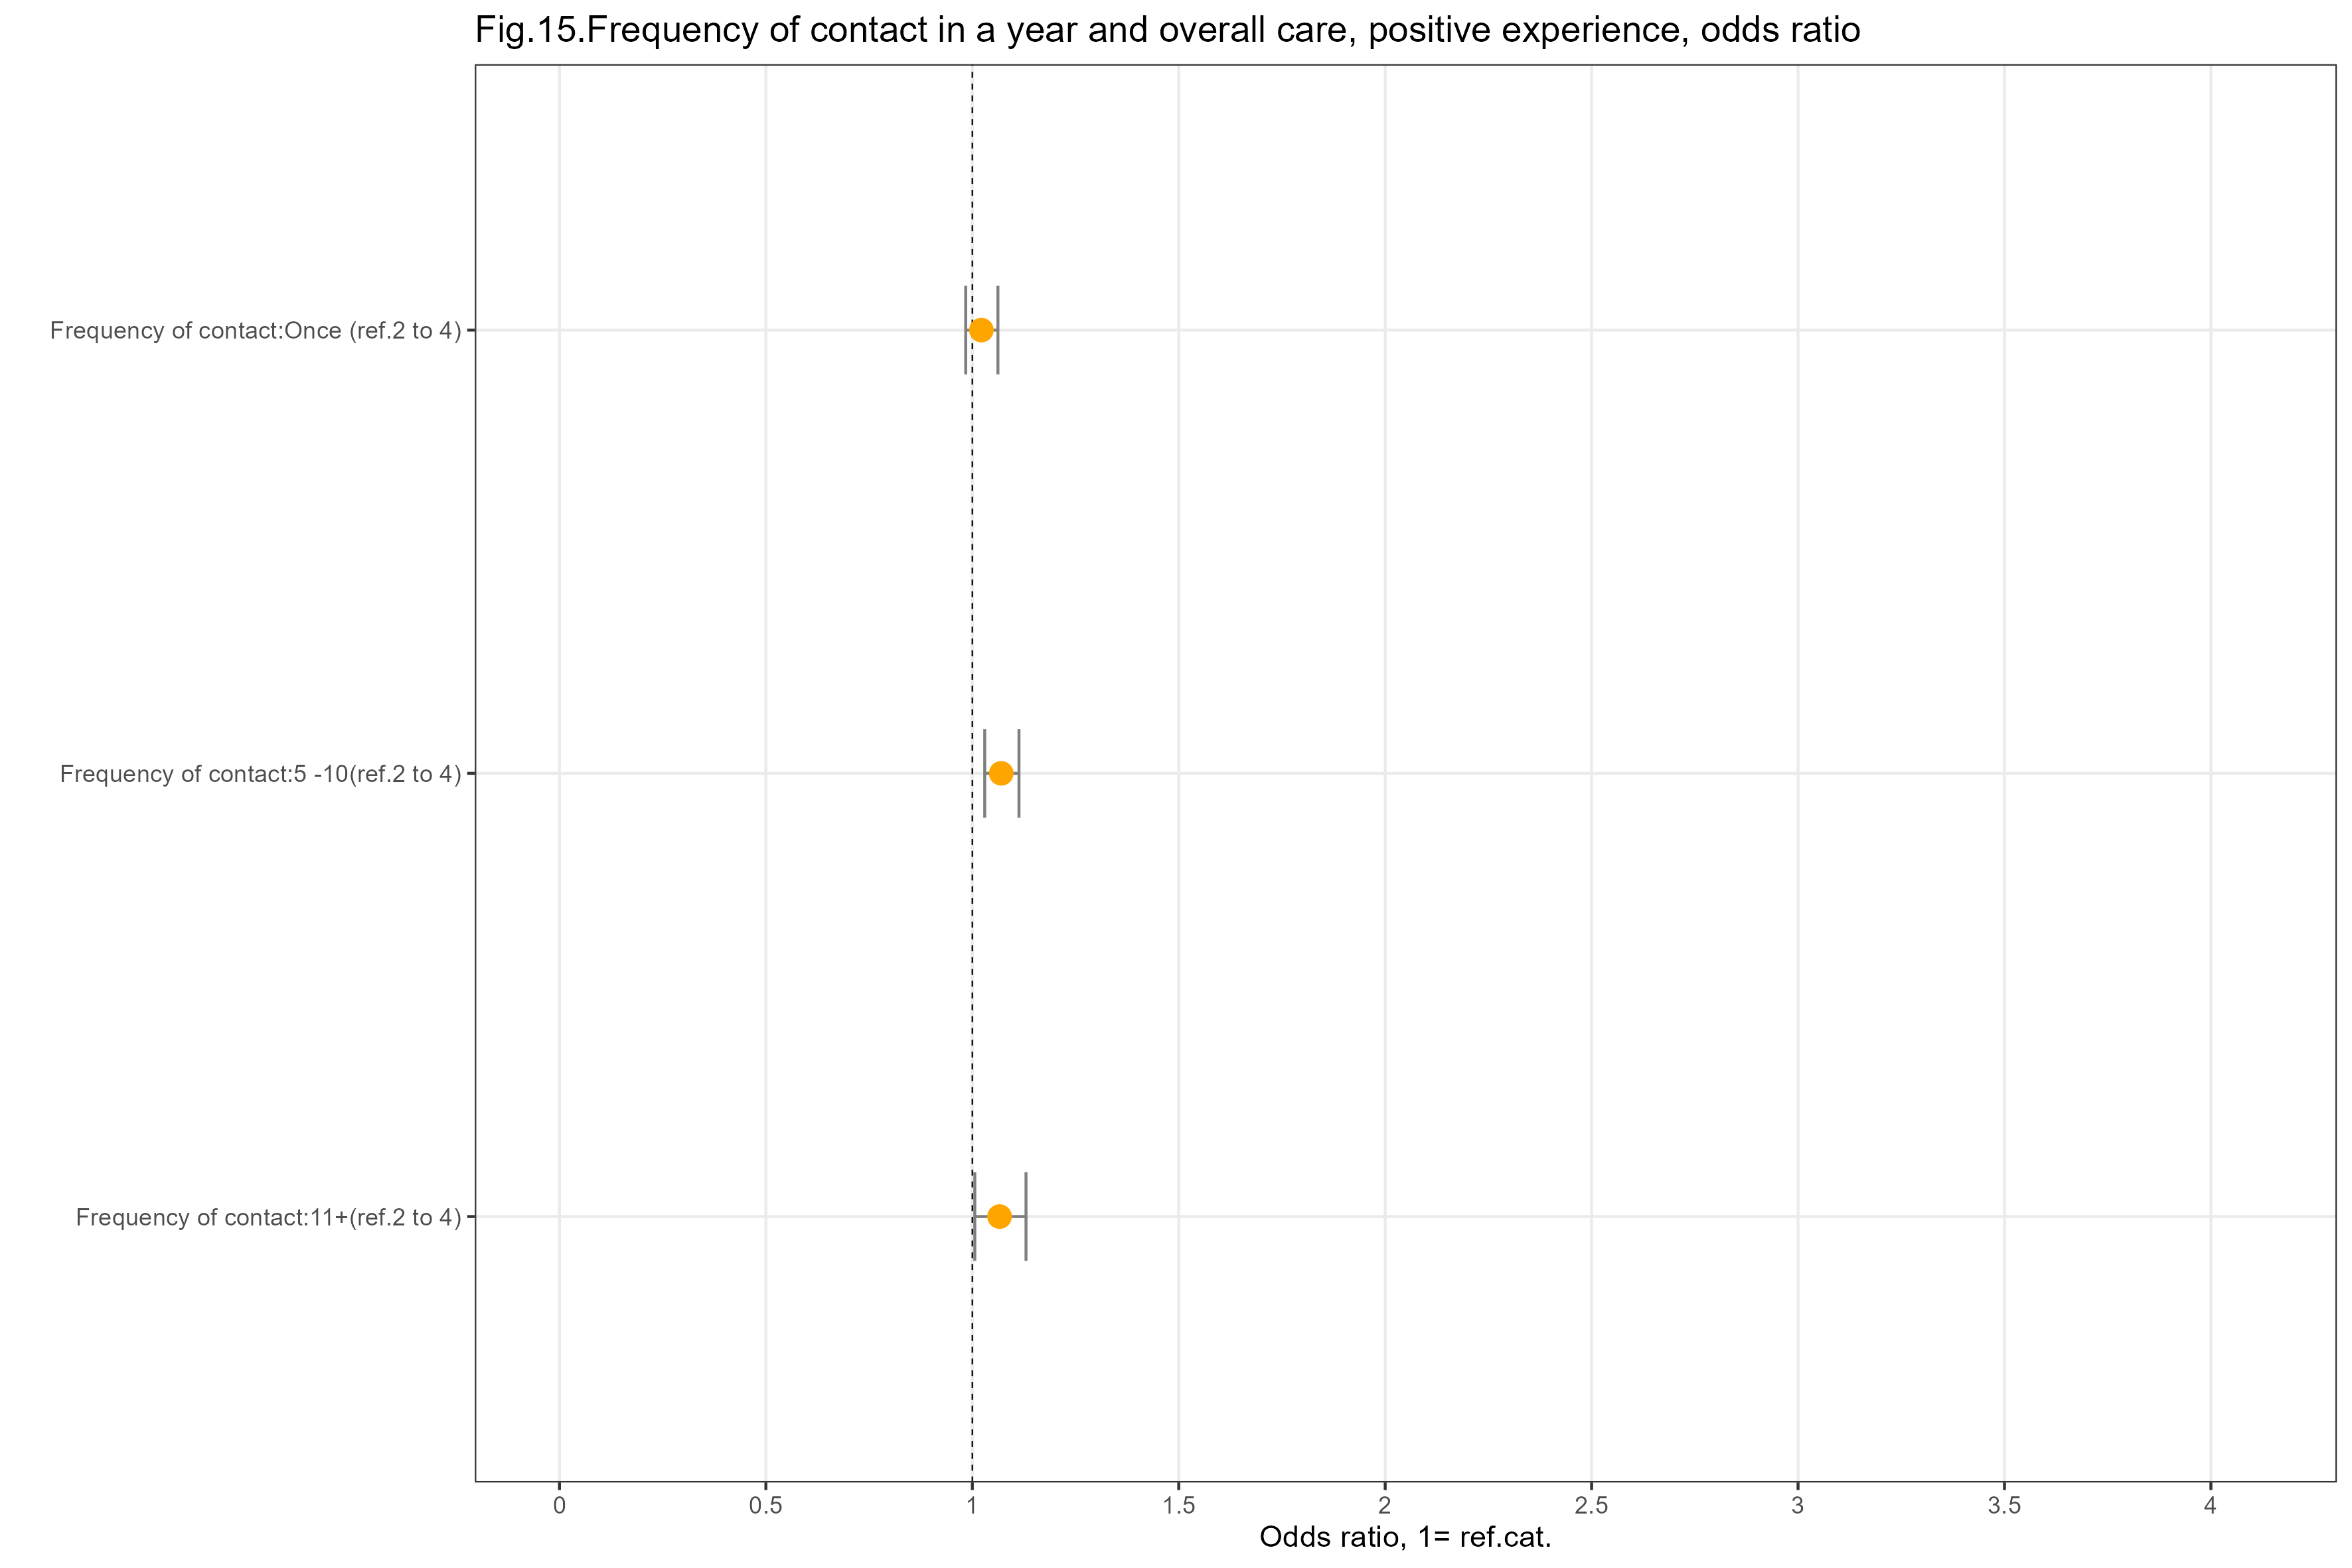
The reference group is people who responded “2-4 times”.
people who have contacted the general practice once in the 12 months prior to the survey have a similar likelihood of rating overall care positively, compared with the reference group
people who have contacted the general practice five or more times in the 12 months prior to the survey are slightly more likely to rate overall care positively, compared with the reference group
The results (OR and confidence intervals) for this factor are shown in the graph below.
Mode of consultation
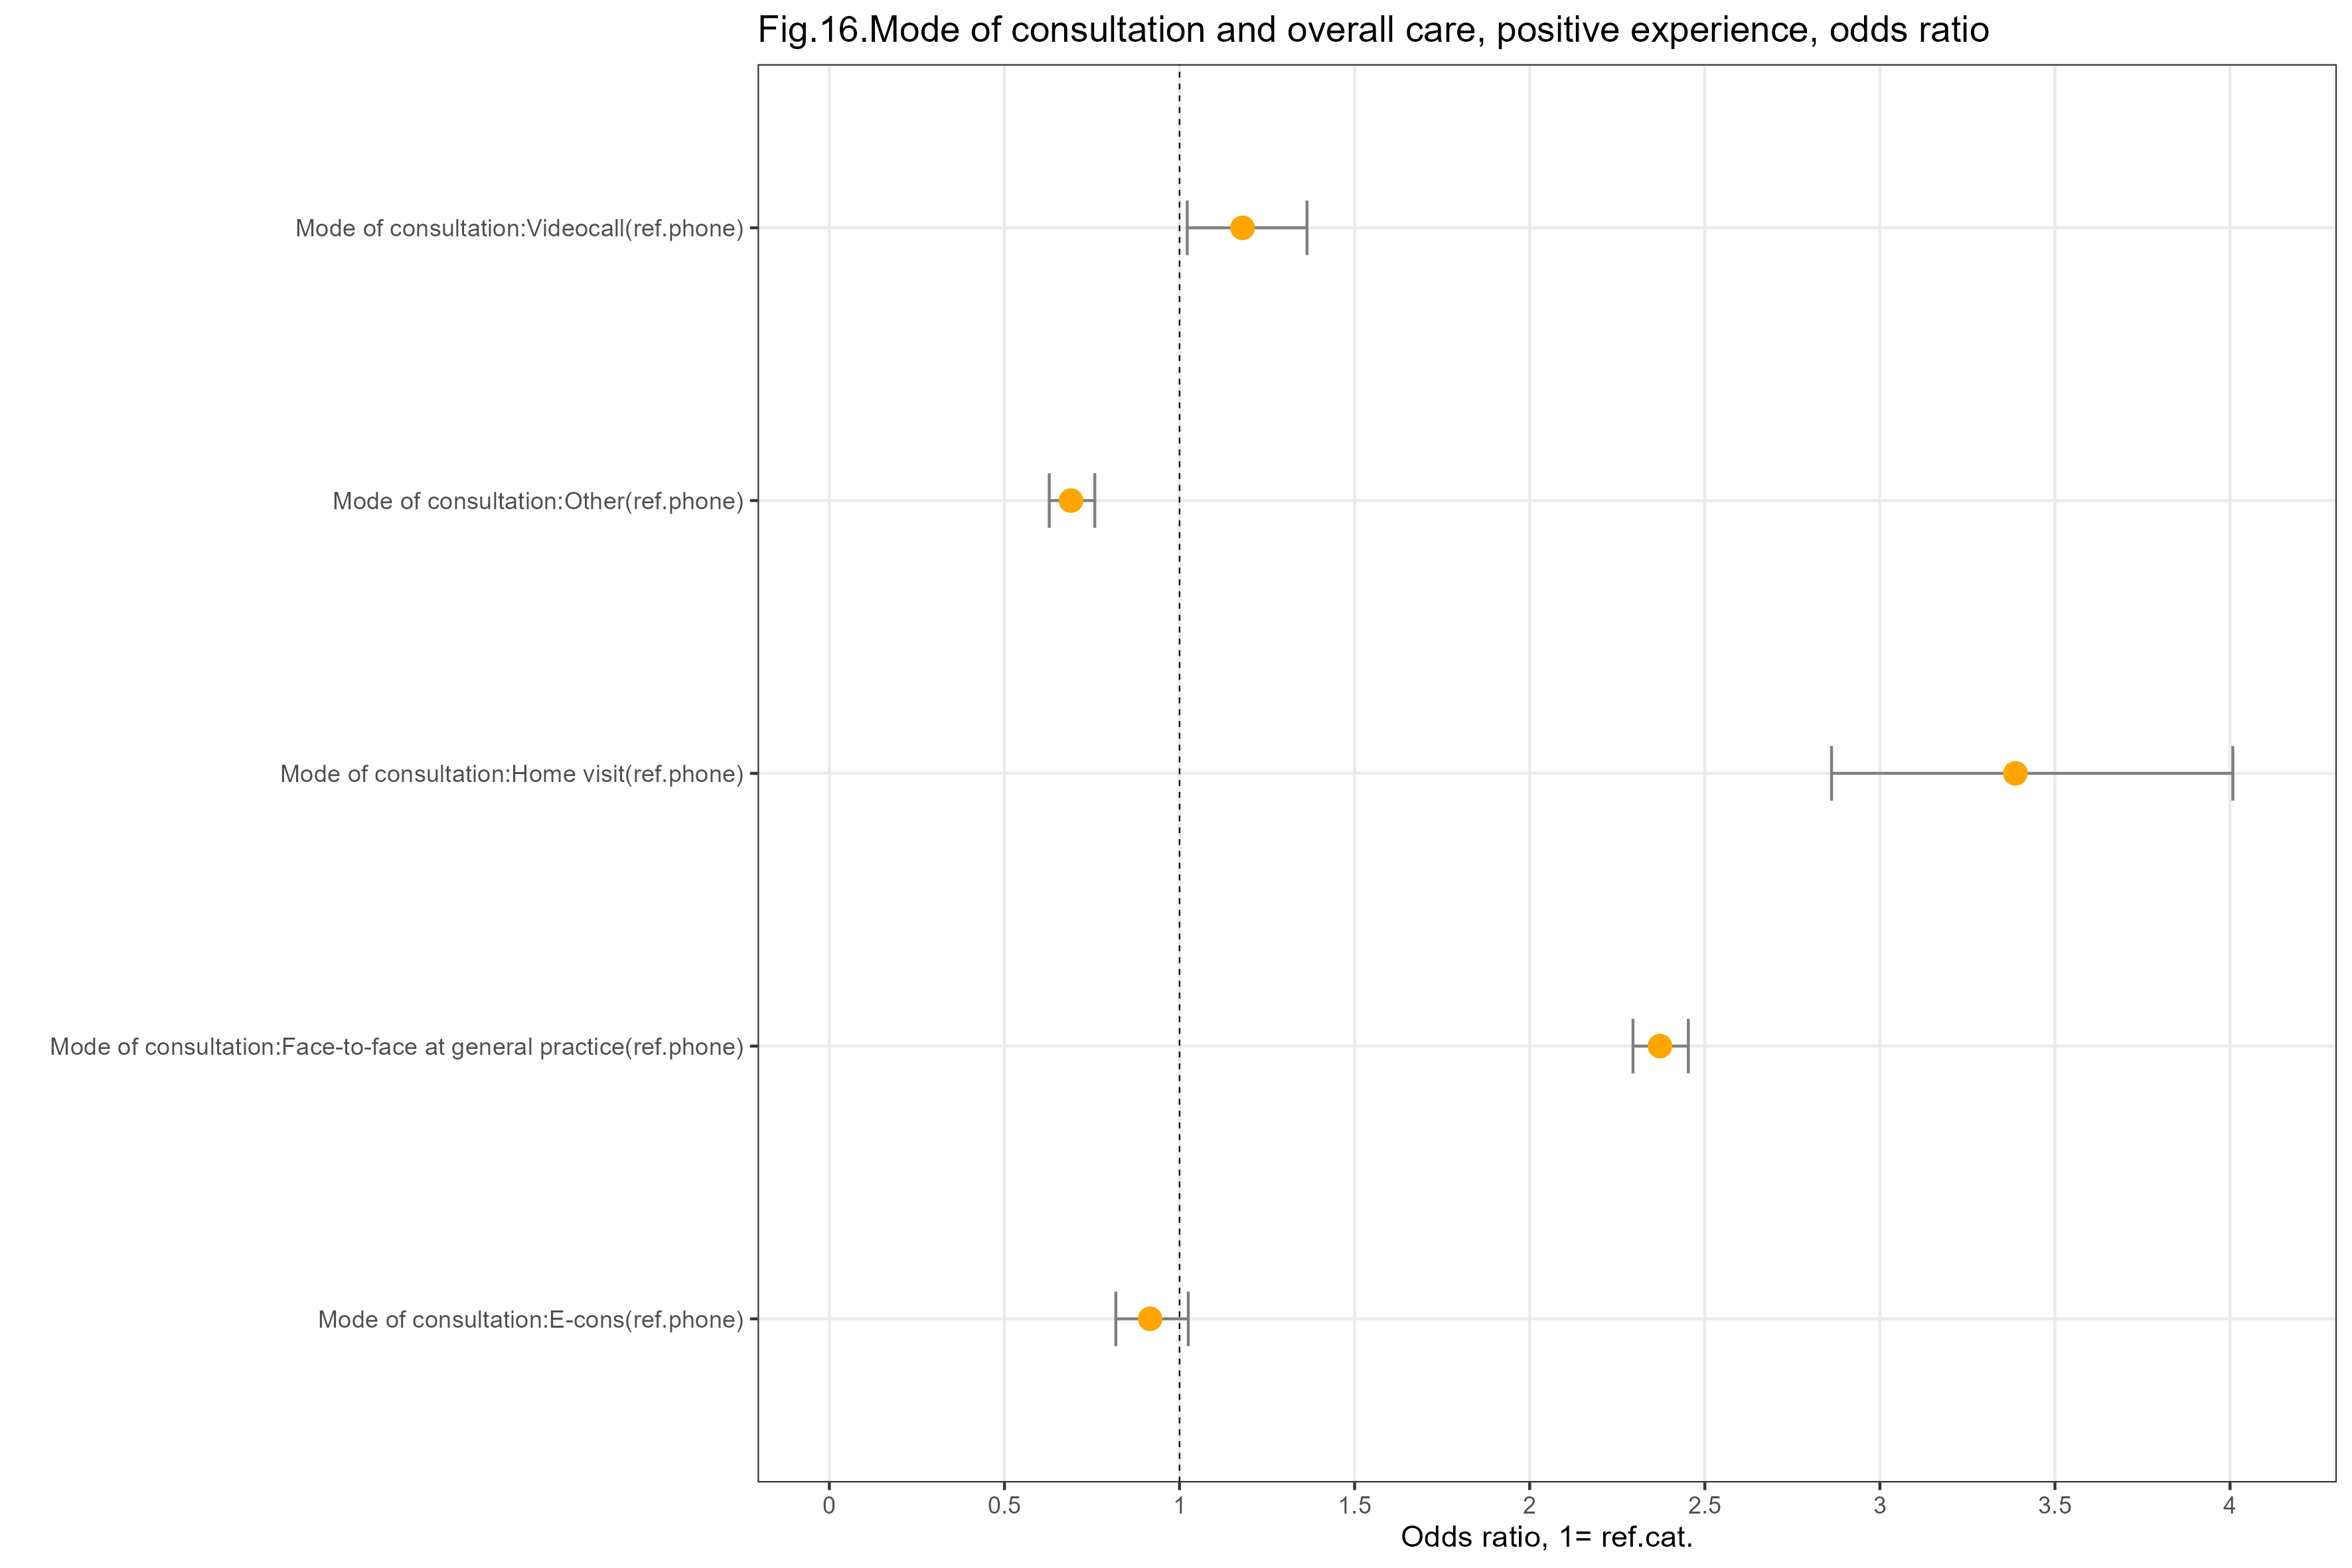
Survey question (Q7): “The last time you needed an appointment with your GP practice, what kind of appointment did you get?”.
The reference group is people who responded “phone”.
people who have had a face to face appointment at the general practice or a home visit are substantially more likely to rate overall care positively, compared with the reference group
people who had a videocall appointment are slightly more likely to rate overall care positively, compared with the reference group
people who had other types of appointments are less likely to rate overall care positively, compared with the reference group
people who had e-Consultation have a similar likelihood of rating overall care positively, compared with the reference group
The results (OR and confidence intervals) for this factor are shown in the graph below.
Healthcare professional
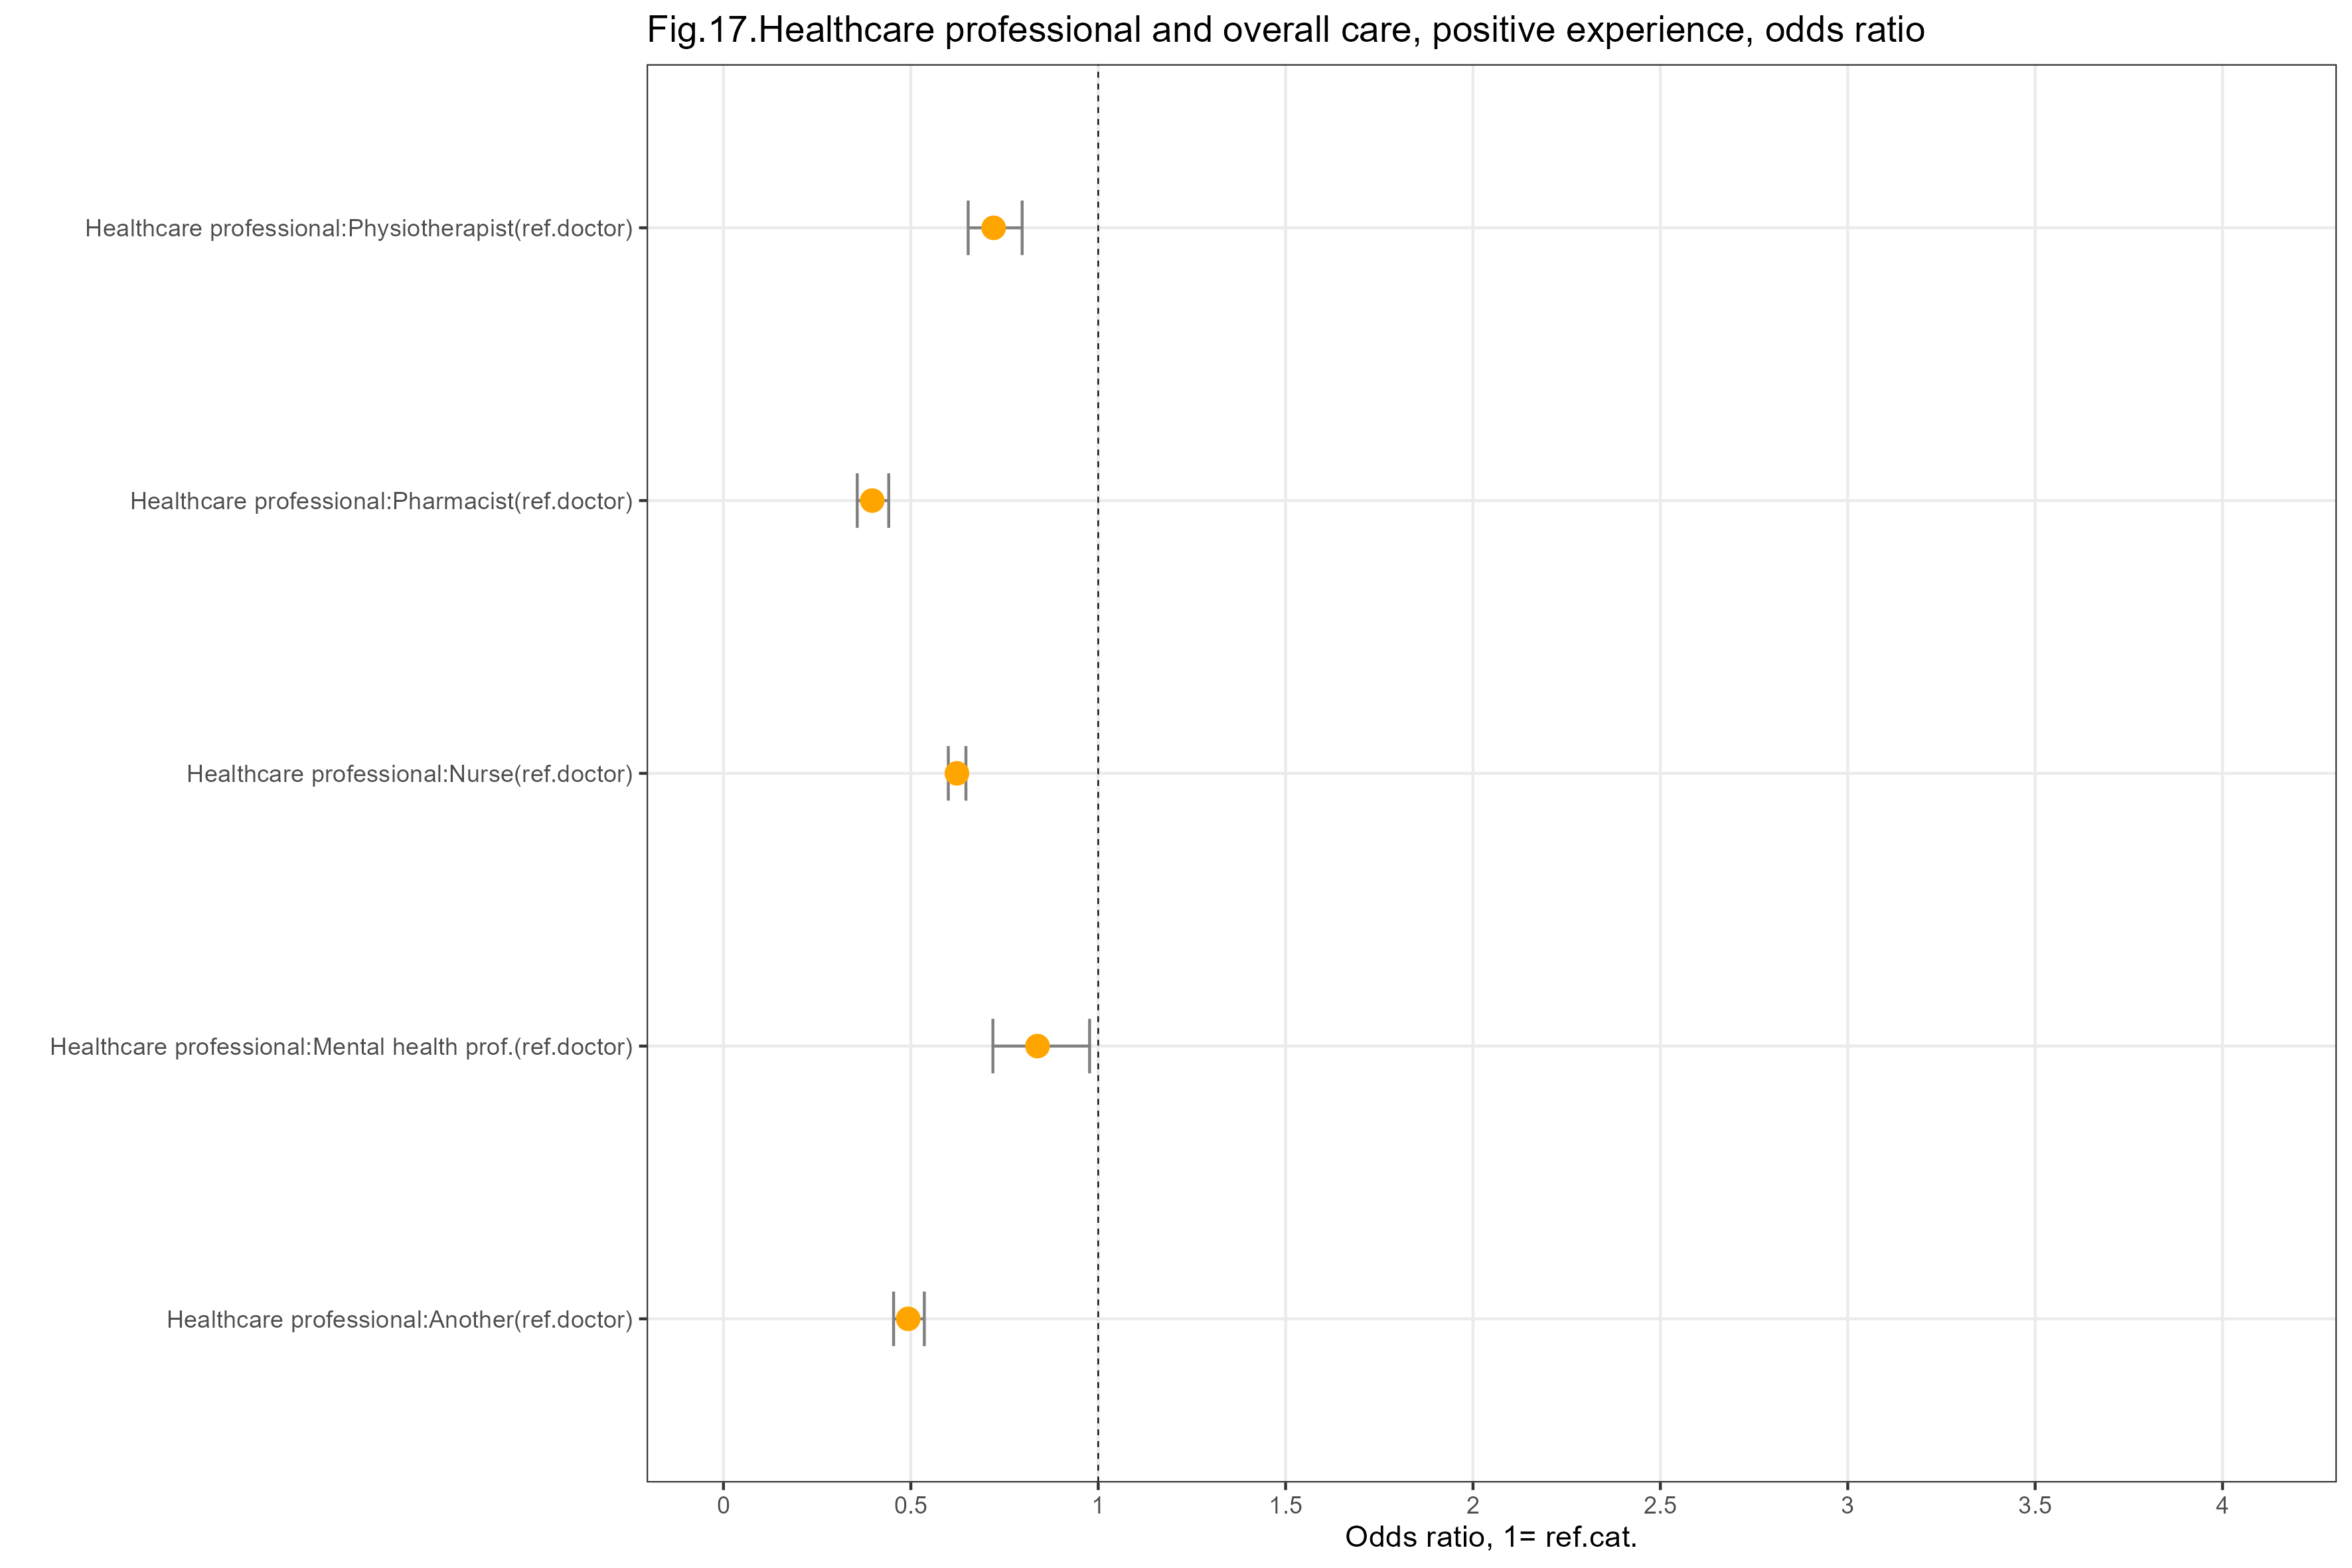
Survey question (Q12): “What type of healthcare professional did you receive most of your treatment or advice from?”.
The reference group is people who responded “doctor”.
people who received most of their treatment or advice from doctors are more likely to rate overall care positively, compared with people who received most of their treatment or advice from any other healthcare professionals
people who received most of their treatment or advice from pharmacists are the least likely to rate overall care positively, compared with all other groups
The results (OR and confidence intervals) for this factor are shown in the graph below.
Treatment or advice
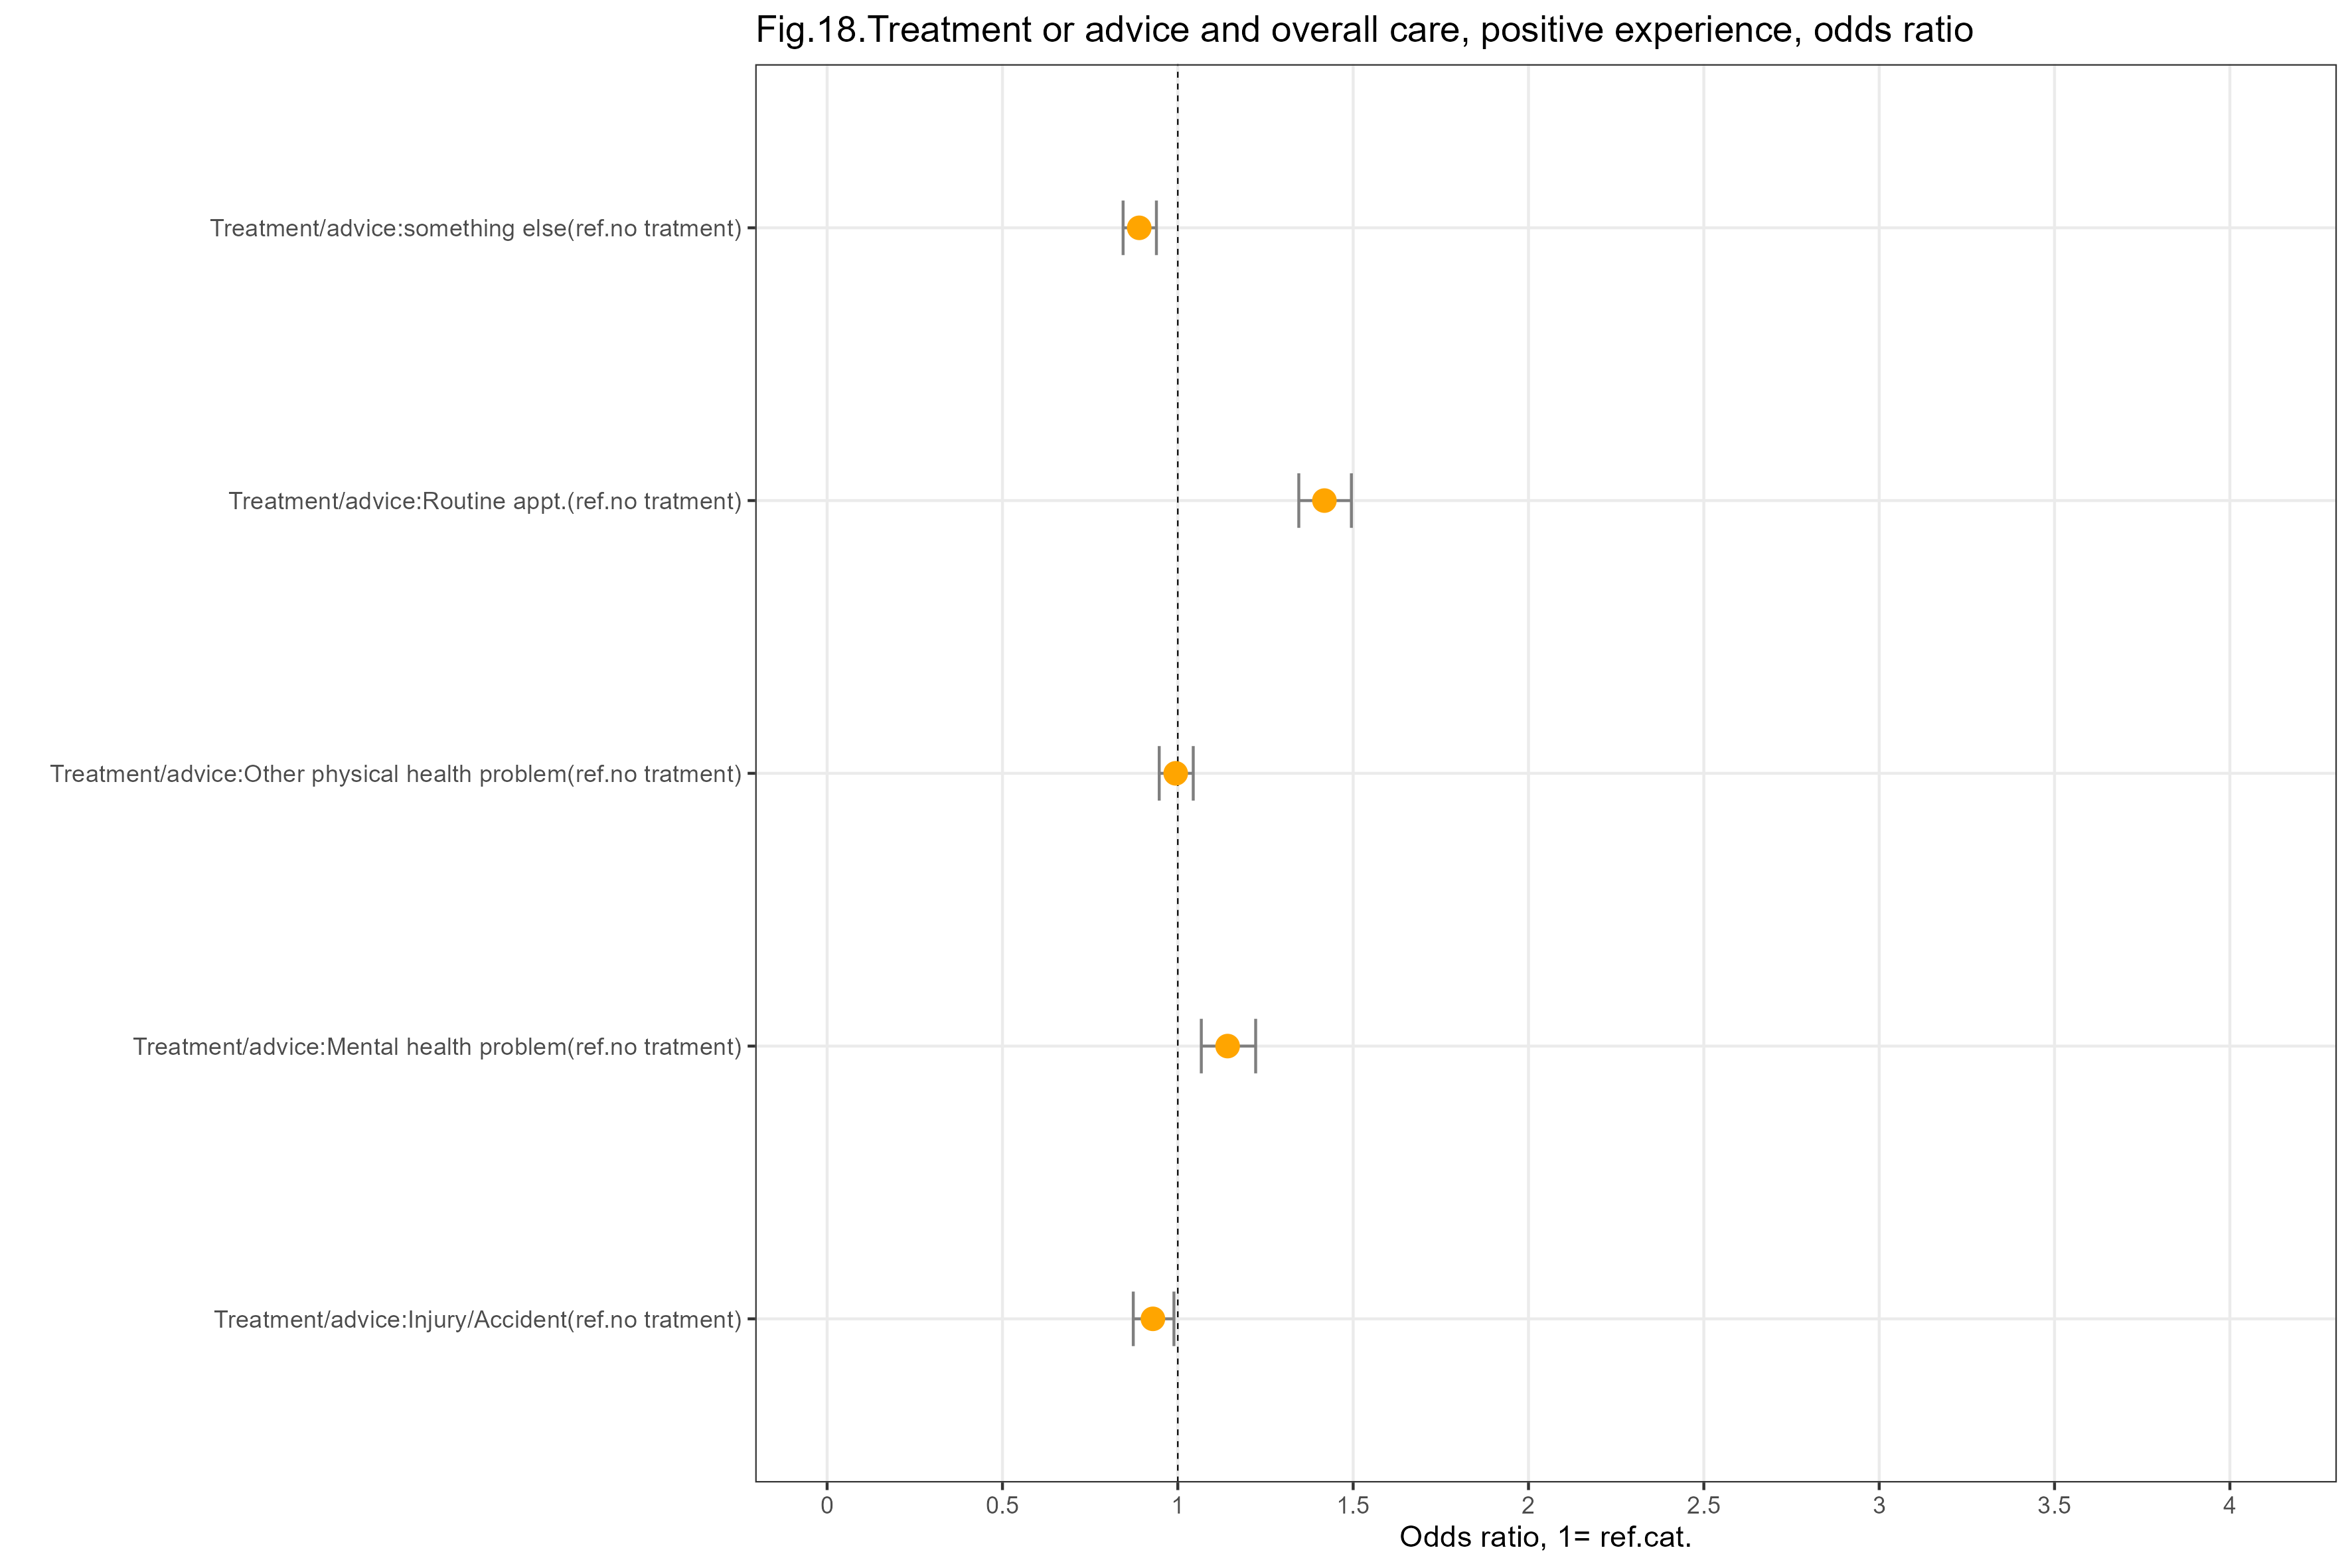
Survey question (Q11): “The last time you received treatment or advice at your GP practice in the last 12 months, what did you receive treatment or advice for? Please tick all that apply”.
The reference group is people who contacted the general practice but did not receive a consultation.
people who received treatment or advice for a routine appointment or for a mental health problem are more likely to rate overall care positively, compared with the reference group
people who received treatment or advice for another physical problem have a similar likelihood of rating positively their overall care, compared with the reference group
people who received treatment or advice for injury/accident or for something else are slightly less likely to rate overall care positively, compared with the reference group
The results (OR and confidence intervals) for this factor are shown in the graph below.

