
data.gov.scot
There has been a change to the scores of Scotland’s Gender Equality Index 2020 following a revision of the data in ONS Time Use Survey: Time Use in Scotland 2020, released in September 2023. Details of the changes can be found in the revised publication. The 2020 scores in this publication reflect the revised data
One of the indicators in the Money domain and one sub-domain and one indicator in the Health domain, have been renamed in the current edition of the Index to better reflect the data gathered from each source. Changes to these names are as follows:
Scotland’s Gender Equality Index is designed to represent gender equality numerically, with a score of one indicating no gender equality and a score of 100 indicating full gender equality. Scotland’s score for 2023 is 79, which is higher than the score of 72 set by the baseline data of the first Gender Equality Index published in 2020. Despite this increase, there is still some way to go before full gender equality is reached.
Scotland’s index is not comprehensive and is based on a relatively small but important set of statistical indicators. Although there are many similarities with the Gender Equality Index published by the European Institute for Gender Equality (EIGE), the two should not be compared as they use a different set of indicators.
The index provides an indication of how close Scotland is to full gender equality across a number of key areas of life for women and men in Scotland. Within the Gender Equality Index these areas are described as ‘domains’ and can be compared to each other to provide an indication of where Scotland has furthest to travel towards full gender equality.
The graphic above indicates how far away Scotland is from full gender equality (100) across the domains chosen for inclusion in the index. In 2023, Health (score 99) was found to be the most equal and Power (score 56) the least. The low score for Power was driven by women’s underrepresentation on the boards of private and public sector organisations, and in senior positions across police, the judiciary, the media and sport, similar to the scores for 2020.
The domain of Work measures the extent to which women and men have equal access to employment and good working conditions. Within the work domain (score 79), inequality was highest in ‘labour market inactivity due to caring’, with caring roles impacting far more women than men. Occupational segregation also contributed to inequality, with more women than men concentrated in the care industries. These findings corroborate the pattern described in the 2020 iteration of the Index.
Within the Knowledge domain (score 81), educational attainment was relatively even, however the main driver of inequality was subject segregation, particularly for Modern Apprentices, where men were much more likely than women to partake in STEM subjects.
The main driver of inequality within the Money domain (score 93) was spending, particularly spending money on self, where there were more women than men avoiding going out because they could not afford it.
Within the Time domain (score 84), the biggest drivers of inequality were ‘housework and cooking’ and ‘non-developmental childcare’, with women spending more time on these activities than men.
These key findings follow a very similar pattern as the baseline data published in 2020, showing that the gender equality landscape has improved only very slightly over the last three years. An update on progress towards gender equality under these measures will be revealed in the next update of this index, which is scheduled for 2026.
Scotland’s Gender Equality Index continues to highlight key areas where policy makers could target and develop programmes to make the largest impact on improving gender equality. It should be noted that most of these data trends move very slowly, with some data only available every two to three years.
The Scottish Government believes that no one should be denied rights or opportunities because of their sex or gender. Everyone in Scotland has a role in reducing and removing the social and economic barriers that result from different expectations and treatment of men and women.
To help measure and understand barriers to sex and gender equality, the Scottish Government committed in 2016 to develop a Gender Equality Index and drew upon the expertise of a working group comprised of stakeholders interested in improving gender equality and data analysts. The working group agreed on six main domains (Health, Knowledge, Money, Power, Time, Work) and two satellite domains (Violence Against Women and Girls and Women-Specific Health), which measure how gender equality changes over time.
The first Gender Equality Index was published in 2020 and provided baseline data for the agreed set of indicators. The current publication presents a comparison against the baseline data from 2020 to produce a better understanding of how gender equality has changed over the last three years.
The bulk of the baseline data was collected prior to the COVID-19 pandemic, thus the first publication shows what gender equality looked like pre-pandemic. However, most of the data informing the current publication was collected post 2020, painting a picture of what things looked like during and post-pandemic. Additionally, some of the data sources underwent substantial methodological changes, including in the ways data was collected.
Considering this, some indicators and their comparability to the previous scores could be affected. Thus, users are advised to take caution when comparing scores from 2020 with current scores from 2023. Changes to the methodology between the years are described in the methodology.
Over time there may be a need for the indicator set to evolve, but this will be kept to a minimum so that the time series remains robust. The intended audience for this index is broad and includes the public, the- media and policy makers who are not data experts but have an interest or a role in advancing sex and gender equality.
Please note that when data for men and women is compared in the following chapters, the data discussed refers to the latest available data at the time of producing each edition of the Index. For this reason reference periods may vary between indicators, with some indicators citing figures from 2018 as ‘previous data’, while others use data from 2019 or 2020. Charts will show the full time series where data is available.
These indicators have been developed by a working group comprised of data analysts and gender equality stakeholders to meet a set of general principles:
measure a relevant aspect of gender equality
be in an area where full equality, rather than universal elimination, is the desirable outcome
minimise any conceptual overlap
differences in outcomes between men and women
be based on robust and reliable data;
In the majority of the data sources used in the Gender Equality Index the respondent has been asked to self-identify either their gender identity or sex by selecting from a choice of binary options of man/male or woman/female. However, as both sex and gender identity have been used in the underlying data for the different indicators depending on which question the source publication asked, using a standard binary definition to refer to each group is not possible. The terms ‘men’ and ‘women’ have been used throughout this report for readability instead of ‘female’ and ‘male’ but it should be noted that the underlying data for some indicators is based on the sex of respondents. Furthermore, some people do not identify as man/male or woman/female, but official data collections still by and large use binary questions. Current guidance from the Scottish Government includes an additional question on trans status.
We have considered equality breakdowns throughout this index and, where applicable, have highlighted which other protected characteristics are gathered in the source publication. In some instances the source publication may include intersectional breakdowns, while in others breakdowns may be provided by other protected characteristics separately from gender. Our notes are designed to act as a signpost for users and further information, if not published on the source website, may be available from Scottish Government analysts via ad hoc requests. Some intersectional data, however, may not be able to be disclosed due to small numbers, and this applies in particular to the ‘Power’ domain where there is currently a lack of intersectional data.
The indicators use ‘official statistics’ unless otherwise specified in the methodology.
Please note, that due to a break in the time series in some of the data sources, we are unable to make comparisons between data published in the previous and current editions of the Index for the indicators of access to flexible working and vertical segregation. As these indicators are used in the calculation of their respected sub-domain scores and the overall domain score and will therefore affect these scores, no comparisons have been made between the 2020 and 2023 scores for the Work domain and quality and segregation sub-domains.
The domain of Work measures the extent to which women and men have equal access to employment and good working conditions. Fair Work can drive productivity, release untapped potential and inspire innovation - all of which add value to jobs and to business and in turn create stronger, more sustainable and more inclusive growth. The refreshed Fair Work Action Plan published 9 December 2022 brings together our original Fair Work, Gender Pay Gap, and Disabled People’s Employment action plans, along with our new Anti-Racist Employment Strategy. It takes forward the next phase of actions to drive forward Fair Work. It will make it easier for employers and partners to access information on the critical role Fair Work has to play in achieving positive economic benefits on both an individual and collective level, how employers can implement fair work practices in their workplaces to experience these benefits, and to create more diverse and inclusive workforce.
The work domain of Scotland’s new index is comprised of the participation, quality and segregation sub-domains.
In 2023, the gender equality score for the work domain is 79. The score for the participation sub-domain is 75, quality has a score of 94, and segregation has a score of 69.
Factors which cause the score to be lower than it may have been are the scores for labour market ‘inactivity’ due to caring (33) in the participation sub-domain and horizontal segregation of care (42) in the segregation sub-domain.
Work Domain gender equality scores 2020 to 2023
The domain of Work measures the extent to which women and men can benefit from equal access to employment and good working conditions. Fair Work can drive productivity, release untapped potential and inspire innovation - all of which add value to jobs and to business and in turn create stronger, more sustainable and inclusive growth.
A gender equality score of 100 represents full gender equality and a score of one represents no gender equality. The higher the score, the more gender equality there is.
The refreshed Fair Work Action Plan sets out actions to enable better Fair Work outcomes for all, as well as specific improvements in the experience of work and the workplace for women, disabled people, and people from racialised minorities. This includes actions on tackling the gender pay gap, the disability employment gap, and actions within our anti-racist employment strategy.
Scotland’s Fair Work Convention has been in place since April 2015 and acts as an independent advisory body to Scottish Ministers. The Convention’s vision is that, by 2025, people in Scotland will have a world-leading working life where fair work drives success, wellbeing and prosperity for individuals, businesses, organisations and society.
Participation in work was selected as a sub-domain within Scotland’s Gender Equality Index to measure women and men’s access to employment, taking into account and reflecting that women are often constrained by traditional social roles as carers and mothers even as they have increasingly entered and remained in the labour market. Work structures are designed in a way that are often inflexible and at odds with those caring roles, and can be a barrier to women’s equal participation in work.
Segregation is also a key sub-domain within Scotland’s Gender Equality Index, and it describes both horizontal and vertical occupational segregation - where women and men work in different industries (for example, caring and retail for women and science, technology, engineering, and mathematics (STEM) for men), but also at different grades or levels of responsibility. Employers have a role to play in tackling occupational segregation and breaking down the barriers that girls and women face in the STEM sector and society as a whole. Scotland’s Fair Work Action Plan recognises a need to tackle structural inequalities such as occupational segregation in subject choice and in post school destinations. Subject choice is often skewed by gender with boys more likely to make subject choices which lead to a wider range of better paid jobs.
The One Scotland website details a series of measures Scotland is taking on Fair Work.
Scottish Government has also set out actions to encourage Women in STEM.
This index also covers vertical segregation, i.e. where women continue not to reach management and senior positions in organisations to the same extent as men.
Quality of work is also included within Scotland’s gender equality index. Creating jobs that are fulfilling, secure and well-paid is a key component of the Scottish Government’s Economic and Labour Market strategies. Beyond headline labour market indicators, the quality of work in our economy can be informed by sector trends, pay levels, opportunities for progression, levels of job satisfaction and other metrics. Quality of work can impact upon the inclusive growth outcomes of participation and people.
Please note, that due to a break in the time series of the source publication, data sourced from the ONS Annual Population Survey for 2020 and after cannot be compared with data for 2019 and before. For this reason this chapter does not compare the data or scores published for the Work domain in the previous Index.
Delivering fair work to a diverse and inclusive workforce is a key priority within the Scottish Government’s Fair Work Action Plan. Scotland’s Fair Work Convention’s vision is that, by 2025, people in Scotland will have a world-leading working life where fair work drives success, wellbeing and prosperity for individuals, businesses, organisations and society.
Women and men can bring different skills and knowledge to the workplace and diverse organisations can experience increased productivity and improved economic performance. The participation sub-domain is designed to measure women’s and men’s access to employment.
It combines four indicators:
participation in full-time equivalent (FTE) employment
labour market ‘inactivity’ due to caring
self-employment
underemployment (hours)
In 2023, the gender equality score for the work participation sub-domain is 75, an increase from 70 in 2020. Despite this increase, this was a relatively low score, compared to other sub-domains, and far from full gender equality.
This lower gender equality score is driven by the labour market ‘inactivity’ due to caring indicator which shows a very low gender equality score of 33 (up slightly from 30 in 2020), with women being more likely to be inactive due to caring responsibilities than men. Although it has also increased from 68 in 2020, the self-employment score remains fairly low, at 76, and the participation in rates of full-time equivalent (FTE) employment score is 89. However, underemployment (hours) represents full equality between women and men with a score of 100.
Participation Sub-Domain gender equality scores 2020 to 2023
The FTE employment indicator provides an insight into paid work participation by women and men and takes into account the higher incidence of part-time employment among women. It is obtained by comparing each worker’s total hours worked with the average number of total hours worked by a full-time worker.
In 2022, the full-time equivalent employment rate for women was 44.5% compared to 56.0% for men. This is a slight increase from 42.0% for women and a slight decrease for men from 58.0% at the time of publishing of the first index in 2020.
Scotland’s score on this indicator has increased from 84 to 89, revealing some inequality in this area, with women’s participation in the labour market still lower than that of men.
Full-time equivalent employment rate, by gender 2004 to 2022
This data is taken from the Annual Population Survey (APS), which highlights the key statistics for Scotland’s labour market.
Breakdowns are available in this data collection by SIMD, age, disability and ethnicity.
The employment rate is the number of people in employment expressed as a percentage of the relevant population. This is different from the Full-Time Equivalent (FTE) employment rate which counts employed persons in a way that makes them comparable although they may work a different number of hours.
Key findings from the source publication on intersectionality include analysis of the employment rate by disability and ethnicity.
Ethnicity
In 2022 the employment rate for minority ethnic people was lower than that for White people. Of minority ethnic people 67.6% were in employment, compared to 74.9% of White people.
Employment rates vary considerably for some groups of women, e.g. some groups of minority ethnic women, and disabled women have a lower employment rate. Analysis of minority ethnic women’s participation in FTE employment is available by Close the Gap.
Disability
In 2022 the employment rate for disabled people was much lower than that for non-disabled people, where 50.7% of disabled people were in employment, compared to 82.5% of non-disabled people.
Intersectional data may be available from Scottish Government analysts via ad hoc requests. Some intersectional data, however, may not be able to be disclosed due to small numbers.
This indicator measures the full-time equivalent employment rate. The reference population was 16-64 year olds. The gender equality score was calculated by comparing the value for women with the mid-point of men and women. See the Methodology chapter for further details.
Full-Time Equivalent (FTE) employment is a measure that counts employed people in a way that makes them comparable although they may work a different number of hours.
Respondents are asked their full-time/part-time status and usual hours worked.
In order to accommodate for the variation in full-time working hours, the average number of usual hours worked by respondents who worked full-time was calculated for each years’ worth of data.
In calculating FTE, respondents who stated they were full-time were given an FTE of 1 and all other respondents’ FTE was calculated using the average number of full-time hours as described above.
Data is taken from the ONS Annual Population Survey APS. This is published on a rolling annual basis, therefore information presented is for January to December of each year. The figures in this publication reflect Scottish Government analysis of the APS survey data.
Women’s access to, and participation in, paid work remains heavily constrained by their traditional social roles as carers and mothers, even as they have increasingly entered and remained in the labour market. The extent of women’s unpaid work is a key influence on their capacity to work in the formal labour market. Therefore, the proportion of 16-64 year old women and men who are ‘economically inactive’ due to looking after family and home is included as an indicator in Scotland’s Gender Equality Index.
In 2022, 83.7% of 16-64 year olds who were ‘inactive’ due to caring were women, compared to the 16.3% that were men. This is very similar to the 85.4% that were women and 14.6% that were men, published in the previous index.
Scotland’s 2023 score on this indicator is 33, making this the indicator with least equality in the Work domain. This is a slight increase from 30 in 2020, but still a long way from full gender equality in this area.
% of people ‘economically inactive’ due to looking after family/home, by gender 2004 to 2022
Data is taken from the ONS Annual Population Survey (APS).
Breakdowns are available in this data collection by age, ethnicity, disability, sexual orientation, religious denomination and SIMD. Intersectional data may be available from Scottish Government analysts via ad hoc requests. Some intersectional data, however, may not be able to be disclosed due to small numbers
This indicator measures the percentage of people ‘economically inactive’ due to looking after family/home. The reference population was all adults who are ‘economically inactive’ due to looking after family/home. The gender equality score was calculated by comparing the value for women with the mid-point of men and women. See the Methodology chapter for further details.
This indicator compares the number of women and men who are economically inactive due to looking after home/family to calculate a proportion. The gender equality score was calculated by comparing the value for women with the mid-point of men and women. See the Methodology chapter for further details.
‘Economically inactive’ people are not in employment, but do not satisfy all the criteria for unemployment. This group is comprised of: those who want a job but who have not been seeking work in the last four weeks; those who want a job and are seeking work but not available to start; and those who do not want a job. For example, students not working or seeking work and those in retirement are classed as economically inactive. It can be useful for some purposes to consider only those who are both economically inactive and not of state pension age.
Data is taken from the ONS Annual Population Survey (APS).
A person is self-employed if they run their business for themselves and take responsibility for its success or failure. Self-employed workers aren’t paid through Pay As You Earn (PAYE), and they don’t have the employment rights and responsibilities of employees. Someone can be both employed and self-employed at the same time, for example if they work for an employer during the day and run their own business in the evenings. ‘Gig economy’ workers, who are paid per short-term task (such as completing a delivery), have also traditionally been classified as self-employed for employment law purposes.
Some forms of self-employment can constitute an alternative to part-time work, whereas others can be associated with long working hours. A gender imbalance in self-employment can indicate an imbalance in access and participation in the labour market.
In 2022, 8.3% of women in employment aged 16+ were self-employed compared to 13.5% of men. In 2018 these numbers were the same for women and slightly higher for men, 16.0%.
Scotland’s 2023 score on this indicator is 76, up from 68 in 2020.
% of workers who are self-employed, by gender 2004 to 2022
Data is taken from the ONS Annual Population Survey (APS)
Breakdowns are available in this data collection by age, ethnicity, disability, sexual orientation, religious denomination and SIMD. Intersectional data may be available from Scottish Government analysts via ad hoc requests. Some intersectional data, however, may not be able to be disclosed due to small numbers
This indicator measures the percentage of workers who are self-employed. The reference population was employees aged 16 and over. The gender equality score was calculated by comparing the value for women with the mid-point of men and women. See the Methodology chapter for further details.
Self-employment: The division between employees and self-employed is based on survey respondents’ own assessment of their employment status.
Data is taken from the ONS Annual Population Survey (APS).
Underemployment refers to people who are in work, but who would prefer to work more hours for the same rate of pay and provides a measure of underutilisation of labour. The Annual Population Survey (APS) gathers information on hours-based underemployment. Specifically, hours-based underemployment covers those looking for: additional hours in their existing role (at the same rate of pay); an additional job (to supplement their existing job); or a different job with more hours. The data used for this indicator within Scotland’s Gender Equality Index is taken from the ONS Annual Population Survey.
In 2022, 6.0% of women in employment aged 16+ were underemployed compared to 5.9% of men. This is a decrease for both women (7.8%) and men (7.1%) in 2018.
In both 2023 and 2020 this indicator is 100 indicating that there is full gender equality in this area. The high score is driven by the high proportion of women and men not underemployed in terms of hours worked, and no difference in the percentages of women and men who were underemployed in 2022.
% of workers who would like to work additional hours given the opportunity, by gender 2004 to 2022
Data is taken from the Annual Population Survey which highlights the key statistics for Scotland’s labour market.
Breakdowns are available in this data collection by age, ethnicity, disability and SIMD. Intersectional data may be available from Scottish Government analysts via ad hoc requests. Some intersectional data, however, may not be able to be disclosed due to small numbers
This indicator measures the percentage of workers who would like to work additional hours given the opportunity. The reference population was employees aged 16 and over. The gender equality score was calculated by comparing the value for women with the mid-point of men and women. For consistency, indicator data was reversed before calculating the equality score so that high percentages correspond to the more desirable outcome. See the Methodology chapter for further details.
The APS only collects information on hours based underemployment. The survey is published on a rolling annual basis, therefore information presented is for January to December of each year. The figures in this publication reflect Scottish Government analysis of the APS survey data.
Creating jobs that are fulfilling, secure and well-paid is a key component of the Scottish Government’s Economic and Labour Market strategies. Beyond headline labour market indicators, the quality of work in our economy can be informed by sector trends, pay levels, whether someone works full time or part time, opportunities for progression, levels of job satisfaction and other metrics. Quality of work can impact upon the inclusive growth outcomes of participation and people.
The International Labour Organization (ILO), which has set out labour standards and developed policies and programmes promoting decent work since 1919, suggests that decent work “delivers a fair income, security in the workplace and social protection for families, better prospects for personal development and social integration, freedom for people to express their concerns, organise and participate in the decisions that affect their lives and equality of opportunity and treatment for all women and men”. The ILO has produced conventions and policy guidance on pay, working time, employment security, collective bargaining, discrimination, and health and safety at work.
In Scotland’s Gender Equality Index, the indicators included in the sub-domain of work quality are access to flexible working and job security.
Scotland’s 2023 score on this sub-domain is 94.
Quality Sub-Domain gender equality scores 2020 to 2023
Flexible working can be important for work life balance and can help increase quality of work and participation in the labour market. Flexible working is a way of working that suits an employee’s needs, including those with caring roles. Workers with caring roles are more likely to be women and a lack of flexible working opportunities can represent a more significant barrier to women than to men.
APS gathers information about types of agreed work arrangement. The question in the survey includes flexible working hours, annualised hours contracts, term-time working, job sharing, nine-day fortnights, four-and-a-half-day weeks, zero hours contracts and on-call working.
In 2022, 28.8% of women in employment aged 16+ had flexible working arrangements compared to 22.8% of men.
Scotland’s 2023 score on this indicator is 88. It should be noted that although this provides an indication of who has access to flexible work, it doesn’t show who needs it in order to participate in the labour market.
% of workers with a flexible working arrangement, by gender 2020 to 2022
Data is taken from ONS Annual Population Survey (APS) which highlights the key statistics for Scotland’s labour market.
Breakdowns are available in this data collection by age, ethnicity, disability and SIMD. Intersectional data may be available from Scottish Government analysts via ad hoc requests. Some intersectional data, however, may not be able to be disclosed due to small numbers
This indicator measures the percentage of workers with a flexible working arrangement. The reference population was employees aged 16 and over. The gender equality score was calculated by comparing the value for women with the mid-point of men and women. See the Methodology chapter for further details.
Data is taken from the ONS Annual Population Survey (APS) which asked:
“Some people have special working hours arrangements that vary daily or weekly. In your (main) job is your agreed working arrangement any of the following:
flexible working hours
annualised hours contract
term-time working
job sharing
nine-day fortnight
four-and-a-half-day week
zero hours contract”
If a respondent answered yes to any of the above options then the respondent was considered to be working flexibly.
Job security can help increase women and men’s quality of life and improve their wellbeing. A lack of job security can be a barrier to home ownership, in particular.
Employment security is based on responses to questions asking about whether employees are employed on a permanent or temporary basis and, if they are employed on a temporary basis, then whether this is because they do not want permanent employment. Other measures related to secure employment include zero hours contracts - it should be noted that a question was recently added to the APS.
In 2022, 93.4% of women in employment aged 18+ had contractually secure jobs compared to 94.8% of men. The numbers for both groups have increased slightly since 2018, when 91.5% of women and 91.2% of men aged 18+ had contractually secure jobs.
Since these figures were close, Scotland’s 2023 score on this indicator (99) is still close to 100 (100 in 2020), which points to almost full equality between women and men under this measure of job security.
% of employees (16+) in contractually secure employment, by gender 2004 to 2022
Breakdowns are available in this data collection by age, ethnicity, disability and SIMD. Intersectional data may be available from Scottish Government analysts via ad hoc requests. Some intersectional data, however, may not be able to be disclosed due to small numbers
This indicator measures the percentage of employees (16+) in contractually secure employment. The reference population was employees aged 16 and over. The gender equality score was calculated by comparing the value for women with the mid-point of men and women. See the Methodology chapter for further details.
Secure employment is based on responses to questions asking about whether employees are employed on a permanent or temporary basis, and if they are employed on a temporary basis, then whether this is because they do not want permanent employment. Other measures related to secure employment include zero hours contracts - it should be noted that a question was recently added to the APS.
The score is based on APS’s current definition of secure employment, though there may be scope to review this in the future.
Occupational segregation is the unequal concentration of men and women in different kinds of jobs (horizontal segregation) and at different levels (vertical segregation). It is caused by factors including gender stereotyping, inflexible working patterns and undervaluation of roles and occupations usually considered ‘women’s work’. The Addressing the gender pay gap report and the International mechanisms to revalue women’s work report provide more details on women’s experiences of the labour market, including occupational segregation.
To help address this, the Scottish Government funds Equate Scotland and Close the Gap along with Flexibility Works where it plays an active role helping to promote the benefits of family-friendly, flexible working for employees and employers. Its aim is to make these ways of working the norm for employees, including men.
In Scotland’s Gender Equality Index, the indicators included in the sub-domain of segregation are Horizontal Segregation (Care), Horizontal Segregation (STEM) and Vertical Segregation.
Scotland’s 2023 score on this sub-domain is 69.
Segregation Sub-Domain gender equality scores 2020 to 2023
Occupational segregation describes where women and men do different types of work, with women and girls more often found in traditionally ‘women’s roles’ such as caring and retail, and men more often in the higher paid professional sectors such as Science, Technology, Engineering and Maths (STEM). Employers have a role to play in tackling occupational segregation and breaking down the barriers that girls and women face in employment and society as a whole.
The Scottish Government is working with partners to address the under-representation of women in certain courses and careers, to ensure that Scotland’s STEM sectors are diverse, equal and prosperous. More information can be found here. Scotland’s Gender Equality Index uses two indicators of horizontal occupational segregation (Care and STEM). Care will be defined using the UK Standard Industrial Classification of Economic Activities (SIC) for health and social care.
In 2022, 11.7% of women in employment aged 16+ were employed in an occupation within the health and social care industrial group compared to 3.1% of men. This is similar to 2018 when 13.2% of women and 2.7% of men worked within health and social care.
Scotland’s 2023 score on this indicator is 42, up from 35 in 2020. The inequality in this indicator makes it the second least equal in the domain after labour market ‘inactivity’ due to caring.
% of workers with an occupation in a Care Sector broad industrial group (SIC 2007), by gender 2009 to 2022
Data is taken from the ONS Annual Population Survey (APS) which highlights the key statistics for Scotland’s labour market.
Breakdowns are available in this data collection by age, ethnicity, disability and SIMD. Intersectional data may be available from Scottish Government analysts via ad hoc requests. Some intersectional data, however, may not be able to be disclosed due to small numbers
This indicator measures the percentage of workers with an occupation in a Care Sector broad industrial group (SIC 2007). The reference population was employees aged 16 and over. The gender equality score was calculated by comparing the value for women with the mid-point of men and women. See the Methodology chapter for further details.
The data is taken from the ONS Annual Population Survey (APS).
Those working in a Care Sector broad industrial group are defined as respondents who reported their industry as one of the following SIC2007 codes:
86.10/2 Medical nursing home activities
87 Residential care activities
88 Social work activities without accommodation
Source: Standard industrial classification of economic activities (SIC).
In Scotland’s Gender Equality Index, STEM is used as a further measure of horizontal occupational segregation. STEM stands for Science, Technology, Engineering and Mathematics and jobs in these fields tend to be professional and higher paid. There is no one accepted definition of STEM in the labour market in use in Government. The main issue is that there are some labour market sectors that are very clearly STEM based e.g. engineering, and some that are not STEM based but include STEM related occupations in them e.g. an accountant in a business or a clinician working in health and social work.
Women are under-represented in a range of STEM-related sectors. As well as impacting on individuals in terms of employment opportunities, income and career progression, employers are also affected. Social attitudes, both explicit and implicit, stereotype the roles women and men, girls and boys have in our society and can be set at an early stage. Segregation is also driven by perceptions and assumptions about what is ‘women’s work’, and what is ‘men’s work’. These traditional gender associations and stereotypes are prevalent in industries and roles such as construction and engineering (which are dominated by men), whilst caring and secretarial roles are dominated by women. Women in STEM careers have a high attrition rate, with the proportion of women decreasing the more senior roles become. There can also be segregation within STEM, in terms of differences in the roles of women and men.
In 2022, of those in employment aged 16+ less women (28.2%) than men (37.3%) were employed in STEM occupations. These numbers have increased for both groups since 2018, when 25.8% of women and 35.2% of men were working in STEM.
Scotland’s 2023 score on this indicator is 86, a decrease from 91 in 2020.
% of workers with an occupation in a STEM broad industrial group (SIC 2007), by gender 2009 to 2022
Data is taken from the Annual Population Survey which highlights the key statistics for Scotland’s labour market.
Breakdowns are available in this data collection by age, ethnicity, disability and SIMD. Intersectional data may be available from Scottish Government analysts via ad hoc requests. Some intersectional data, however, may not be able to be disclosed due to small numbers
This indicator measures the percentage of workers with an occupation in a STEM broad industrial group (SIC 2007). The reference population was employees aged 16 and over. The gender equality score was calculated by comparing the value for women with the mid-point of men and women. See the Methodology chapter for further details.
The data is taken from the APS.
Those working in STEM industries are defined as respondents who reported their industry as one of the following SIC2007 codes:
02.4 Support services to forestry
06.1 Extraction of crude petroleum
06.2 Extraction of natural gas
09.1 Support activities for petroleum and natural gas extraction
12.0 Manufacture of tobacco products
18.1 Printing and service activities related to printing
18.2 Reproduction of recorded media
19.2 Manufacture of refined petroleum products
20.1 Manufacture of basic chemicals, fertilisers and nitrogen compounds, plastics and synthetic rubber in primary forms
20.2 Manufacture of pesticides and other agrochemical products
20.3 Manufacture of paints, varnishes and similar coatings, printing ink and mastics
20.4 Manufacture of soap and detergents, cleaning and polishing preparations, perfumes and toilet preparations
20.5 Manufacture of other chemical products
20.6 Manufacture of man-made fibres
21.1 Manufacture of basic pharmaceutical products
21.2 Manufacture of pharmaceutical preparations
24.5 Casting of metals
25.4 Manufacture of weapons and ammunition
25.6 Treatment and coating of metals; machining
26.1 Manufacture of electronic components and boards
26.2 Manufacture of computers and peripheral equipment
26.3 Manufacture of communication equipment
26.4 Manufacture of consumer electronics
26.5 Manufacture of instruments and appliances for measuring, testing and navigation; watches and clocks
26.6 Manufacture of irradiation, electromedical and electrotherapeutic equipment
26.7 Manufacture of optical instruments and photographic equipment
26.8 Manufacture of magnetic and optical media
27.1 Manufacture of electric motors, generators, transformers and electricity distribution and control apparatus
27.2 Manufacture of batteries and accumulators
27.3 Manufacture of wiring and wiring devices
27.4 Manufacture of electric lighting equipment
27.5 Manufacture of domestic appliances
27.9 Manufacture of other electrical equipment
28.4 Manufacture of metal forming machinery and machine tools
28.9 Manufacture of other special-purpose machinery
30.1 Building of ships and boats
30.2 Manufacture of railway locomotives and rolling stock
30.3 Manufacture of air and spacecraft and related machinery
30.4 Manufacture of military fighting vehicles
32.9 Other manufacturing
33.1 Repair of fabricated metal products, machinery and equipment
33.2 Installation of industrial machinery and equipment
35.1 Electric power generation, transmission and distribution
35.2 Manufacture of gas; distribution of gaseous fuels through mains
35.3 Steam and air conditioning supply
36.0 Water collection, treatment and supply
37.0 Sewerage
38.1 Waste collection
38.2 Waste treatment and disposal
38.3 Materials recovery
39.0 Remediation activities and other waste management services
41.1 Development of building projects
41.2 Construction of residential and non-residential buildings
42.1 Construction of roads and railways
42.2 Construction of utility projects
42.9 Construction of other civil engineering projects
46.1 Wholesale on a fee or contract basis
46.7 Other specialised wholesale
52.2 Support activities for transportation
58.2 Software publishing
61.1 Wired telecommunications activities
61.2 Wireless telecommunications activities
61.3 Satellite telecommunications activities
61.9 Other telecommunications activities
62.0 Computer programming, consultancy and related activities
63.1 Data processing, hosting and related activities; web portals
63.9 Other information service activities
66.1 Activities auxiliary to financial services, except insurance and pension funding
66.2 Activities auxiliary to insurance and pension funding
70.2 Management consultancy activities
71.1 Architectural and engineering activities and related technical consultancy
71.2 Technical testing and analysis
72.1 Research and experimental development on natural sciences and engineering
74.9 Other professional, scientific and technical activities n.e.c.
75.0 Veterinary activities
84.22 Defence Activities (within 84.2 Provision of services to the community as a whole)
85.4 Higher education
85.59 Other education nec (within 85.5 Other education)
86.1 Hospital activities
86.2 Medical and dental practice activities
86.9 Other human health activities
94.11 Activities of employer member organisations (within 94.1 Activities of business, employers and professional membership organisations)
95.1 Repair of computers and communication equipment
Source: Scotland’s STEM Strategy
There is evidence that women continue not to reach management and senior positions in organisations to the same extent as men. There are two issues that are said to affect women’s movement between junior and senior positions: the ‘glass ceiling’ effect and the ‘sticky floor’ effect.
The ‘glass ceiling’ hypothesis is that there are specific barriers limiting women’s participation in senior positions within organisations (therefore perpetuating vertical occupational segregation), and there is evidence that women do remain under-represented in the most senior positions.
The ‘sticky floor’ hypothesis is that women and other minority groups are ‘stuck’ in low-skilled, low-paid jobs often without access to higher paid jobs due to limited availability of training or promotion prospects. This ‘sticky floor’ effect is thought to be particularly acute within part-time employment.
To measure vertical segregation Scotland’s Gender Equality Index uses the percentage of workers in ‘Major Occupational Classification Group 1: Managers and Senior Officials’. (SOC 2010)
In 2022, 7.0% of women in employment aged 16+ were employed in Major Occupational Classification Group 1: Managers and Senior Officials (SOC 2020) compared to 10.6% of men.
Scotland’s 2023 score on this indicator is 80.
% of workers in major occupational group 1: Managers and Senior Officials, by gender 2020 to 2022
Breakdowns are available in this data collection by age, ethnicity, disability and SIMD. Intersectional data may be available from Scottish Government analysts via ad hoc requests. Some intersectional data, however, may not be able to be disclosed due to small numbers
This indicator measures the percentage of workers in major occupational group 1: Managers and Senior Officials. The reference population was employees aged 16 and over. The gender equality score was calculated by comparing the value for women with the mid-point of men and women. See the Methodology chapter for further details.
Data is drawn from Scottish Government analysis on the APS data.
Standard Occupational Classification for the UK
The domain of Money measures gender inequalities in access to financial resources and in women’s and men’s economic situations.
“Assessing the domain of money is important from a gender equality perspective, as ensuring women’s and men’s equal rights and access to financial resources is a prerequisite for reaching equal economic independence and for addressing the increasing feminisation of poverty specifically and growing income inequalities more generally” (European Institute for Gender Equality).
The money domain within Scotland’s Gender Equality Index has three sub-domains - income, limited independent resources and wealth. Within these, statistical indicators show gender inequality with regards to financial resources for women and men in Scotland.
In 2023, Scotland’s gender equality score for the money domain is 93. There is more equality than in 2020 across all three sub-domains, most notably in the wealth domain:
the income sub-domain has a score of 93, a rise from 88 in 2020
the limited independent resources sub-domain has a score of 93, consistent with the score of 94 in 2020
the wealth sub-domain has a score of 91, a substantial rise from 74 in 2020
Money Domain gender equality scores 2020 to 2023
The domain of money in Scotland’s Gender Equality Index measures gender inequalities in access to financial resources and in women’s and men’s economic situation. Equality for women is at the heart of the Scottish Government’s vision for a fairer Scotland but financial gender inequality still exists, as underlined by the size of the gender pay gap and high poverty rates, especially for single women with children.
The working group recommended that income, limited independent resources and wealth were the key areas of financial inequality which impact on life chances. These were, therefore, selected as the sub-domains for the money domain of Scotland’s gender equality index.
Income is key to a person’s access to financial resources and their economic situation - it is, therefore, an important sub-domain within the Money domain of Scotland’s Gender Equality Index. The IMF report that gender inequality is strongly associated with income inequality.
Income is wider than earnings and includes a range of other sources, such as social security payments, tax credits, pension income and investments. However, it is generally measured at a household level in Scotland, which makes it difficult to measure for individual adults living with a partner.
In Scotland’s Gender Equality Index, the indicators included in the money sub-domain of income are: earnings, income pooling and the Living Wage.
Using the measures available, in 2023, Scotland’s gender equality score for the income sub-domain is 93. This is an increase from 88 in 2020.
Income Sub-Domain gender equality scores 2020 to 2023
The Scottish Government sets out in its refreshed Fair Work Action Plan a commitment to reduce the gender pay gap and to tackle the labour market inequalities faced by those who are marginalised in the labour market, particularly women, women from racialised minorities, disabled women, and women over 50 years.
The gender pay gap is caused by a range of complex, inter-related factors including occupational segregation (where men and women do different types and levels of work), lack of flexible working opportunities and discrimination in pay and grading structures. This was, therefore, an important indicator to include within Scotland’s Gender Equality Index and the indicator chosen measures the gap in median hourly earnings (excluding overtime) between men and women working in Scotland.
It was agreed by the working group that the measure that took into account the earnings of all employees (including part-time workers) made for a better and more representative indicator than the full-time gender pay gap. The overall gender pay gap reflects wider drivers that channel more women towards lower paid part-time work, and can be presented alongside the full-time gender pay gap for a fuller discussion of the pay gap.
Median hourly pay, excluding overtime (£), by gender 2004 to 2022
Source: Annual Survey of Hours and Earnings (ASHE)
The latest data shows that, in 2022, the median hourly earnings (excluding overtime) for women was £14.10 per hour compared to £16.00 per hour for men. Although the hourly rate has steadily increased over time, the gap between women and men remains.
Note that the indicator chosen for the Gender Equality Index measures median hourly pay, excluding overtime, for all employees, but it should be noted that the indicator within Scotland’s National Performance Framework measures full-time workers only.
Scotland’s score on this indicator is 94, a slight increase from 92 in 2020.
Median full-time hourly pay, excluding overtime (£) 2004 to 2022
Source: Annual Survey of Hours and Earnings (ASHE)
In 2022, the median full-time hourly earnings (excluding overtime) for women was £16.30 per hour compared to £16.90 per hour for men. This is an increase on 2018, when the median full-time hourly earnings (excluding overtime) for women was per hour compared to per hour for men.
It should be noted that the indicator within Scotland’s National Performance Framework also measures full-time workers only.
The Scottish Government takes an intersectional approach in its refreshed Fair Work Action Plan seeking to ensure that actions being taken can benefit as many people as possible and particularly those most disadvantaged by inequality and face multiple barriers and compounded discrimination in the labour market, such as, disabled women or women from racialised minorities.
The data for this indicator is gathered through the Annual Survey of Hours and Earnings (ASHE), by Office for National Statistics (ONS), and can be broken down by age. This breakdown is available on the Equality Evidence Finder.
This indicator measures the median hourly pay, excluding overtime. The reference population was employees aged 16 and over. The gender equality score was calculated by comparing the value for women with the mid-point of men and women. See the Methodology chapter for further details.
It should be noted that the official gender pay gap measure compares the percentage difference between men’s and women’s hourly earnings with men’s earnings, whereas the Gender Equality Index earnings equality score compares women with the mid-point between women and men. This allows for greater comparability with other gender equality scores in the Gender Equality Index.
The data for this indicator is taken from the Scottish Government analysis of the Annual Survey of Hours and Earnings (ASHE).
ASHE is the most detailed and comprehensive source of earnings across the UK produced by the ONS. The survey, carried out by ONS annually, is based on a 1% sample of employee jobs taken from HM Revenue and Customs Pay As You Earn (PAYE) records. Data on hours and earnings is gathered from employers and is treated confidentially. ASHE does not cover self-employed people or employees not paid during the reference period. See the latest ONS ASHE publication for further details.
The median is a measure of the average and is calculated by identifying the exact middle point in a set of observations. When the observations are ranked from lowest to highest, the median is the value in the exact middle of the observed values. Although no single measure best measures the differences between men’s and women’s pay, the median is the Office for National Statistics’ (ONS) preferred measure of average earnings as it is less affected by a relatively small number of very high earners than the mean.
Including overtime would skew results as men typically work more overtime than women.
Statistics on income pooling can provide an insight into the distribution of, and an indication of access to, finances within households.
Information on how couples in Scotland managed their household finances was gathered in an online omnibus survey carried out by YouGov between 27 July and 7 August 2023. The sample was 1,148 adults in Scotland living with a spouse or partner of which 593 were women and 555 were men. Note that this represents a change in methodology from the 2020 Gender Equality Index in which data was gathered in the Scottish Social Attitudes Survey (SSA) Intra-household distribution of resources module 2019.
Couples were asked what proportion of their and their partner’s income was pooled and what proportion was kept to themselves. In 2023, 46.4% of women and 35.9% of men who lived with a partner kept all/most of their own income. This is a smaller difference than in 2019 in which 39.7% of women and 24.8% of men who lived with a partners kept all/most of their own income.
Scotland’s score on this indicator is 87, an increase from 77 in 2020.
% of adults living with a partner who kept all/most of their own income, by gender 2019 to 2023
Source: YouGov
Please note that data from 2023 comes from a survey carried out by YouGov, while data from 2019 was sourced from the the Scottish Social Attitudes Survey (SSA) Intra-household distribution of resources module 2019. Respondents in both were asked the same question, however, as the data sources differ in nature, caution is advised when comparing the two figures directly.
No intersectional breakdowns are available for this indicator based on the YouGov omnibus survey.
For the 2019 data, breakdowns are available in the Scottish Social Attitudes Survey (SSA) Intra-household distribution of resources module 2019 by age, disability and SIMD. Intersectional data may be available from Scottish Government analysts via ad hoc requests. Some intersectional data, however, may not be able to be disclosed due to small numbers.
This indicator measures the percentage of adults living with a partner who kept all/most of their own income. The reference population was adults (16+) living with a partner. The gender equality score was calculated by comparing the value for women with the mid-point of men and women. See the Methodology chapter for further details.
The 2023 data was gathered in a survey carried out by YouGov Plc. The total sample size was 2,015 adults in Scotland, of which 1,088 reported that they were living with a spouse or partner. Fieldwork was undertaken between 27th July - 7th August 2023. The survey was carried out online. The figures have been weighted and are representative of all Scotland adults (aged 16+).
The survey asked respondents:
“People organise their income in different ways. Which of the following statements comes closest to what you do with your own personal income?
I keep all (or almost all) of my own income
I keep most of my own income and put the rest into a joint bank account or pool with my partner
I keep about half of my own income and put the other half into a joint bank account or pool with my partner
I keep some of my own income and put the rest into a joint bank account or pool with my partner
I keep none (or almost none) of my own income and put all (or almost all) of it into a joint bank account or pool with my partner
Data for this indicator in the 2020 Gender Equality Index was gathered in the The Scottish Social Attitudes Survey (SSA) Intra-household distribution of resources module 2019. Methodological details can be found in the SSAS 2019 technical paper.
Readers should note the methodological changes in the collection of data for this indicator when comparing the 2023 and 2020 gender equality scores.
The Real Living Wage is calculated using a public consultation method called the Minimum Income Standard to represent the minimum pay rate required for a worker to meaningfully participate in society. It is based on detailed research into the types of goods or services members of the public think are needed to reach a socially acceptable standard of living. There is no legal requirement on employers to pay the Real Living Wage, unlike the statutory National Minimum Wage (NMW). Since October 2021 the Scottish Government has routinely mandated payment of the real living wage in contracts. It is possible to require the real Living Wage to be paid to workers on public contracts, where Fair Work First practices, including payment of the real Living Wage, is relevant to how the contract will be delivered; it does not discriminate amongst potential bidders; it is proportionate to do so; the contract will be delivered by workers based in the UK.
The Scottish Government supports the Scottish Living Wage Campaign as one of the measures to address poverty in Scotland, and it has published guidance on how procurement processes can encourage payment of the Real Living Wage, as part of a wider package of workforce matters.
In 2022, 89.7% of women earned the living wage or more compared to 92.5% of men. This is an increase from 77.6% of women and 84.0% of men in 2018. Scotland’s score on this indicator is 98, a slight increase from 96.
% of employees earning the real Living Wage or more, by gender 2012 to 2022
Living Wage analysis from the Annual Survey of Hours and Earnings (ASHE) covers those aged 18 and over on the PAYE system and whose pay was not affected by absence. Data can be broken down by age.
Intersectional data may be available from Scottish Government analysts via ad hoc requests. Some intersectional data, however, may not be able to be disclosed due to small numbers
This indicator measures the percentage of employees earning the real Living Wage or more. The reference population was employees aged 18 and over. The gender equality score was calculated by comparing the value for women with the mid-point of men and women. See the Methodology chapter for further details.
The Real Living Wage rates have been independently calculated by the Resolution Foundation according to the cost of living based on household goods and services. Current and historical Real Living Wage rates is published by the Living Wage Foundation
Data is taken from the Scottish Government analysis of the Annual Survey of Hours and Earnings (ASHE), which covers those aged 18 and over on the PAYE system and whose pay was not affected by absence.
The survey, carried out by ONS annually, is based on a 1% sample of employee jobs taken from HM Revenue and Customs PAYE records. Data on hours and earnings is gathered from employers and is treated confidentially. ASHE does not cover those who are self-employed or employees who were not paid during the survey reference period.
Women are more likely to have caring roles, more likely to work part-time, and earn less on average. Whilst at a household level, income pooling between higher-earners and lower-earners may be sufficient to keep a household above the poverty line, this may mask disparities in access to resources and decision-making over household spending.
This sub-domain focuses on adults with limited independent resources, across material deprivation, low income, and decision-making over spending. However, data is limited on how household expenses and individual income are shared within a household, and we recognise that this isn’t the full picture.
Scotland’s gender equality score for this sub-domain is a relatively high 93. This is broadly consistent with the gender equality score for this sub-domain in 2020, which was 94.
Limited independent resources Sub-Domain gender equality scores 2020 to 2023
Material deprivation is a way of measuring living standards and refers to the self-reported inability of individuals or households to afford particular goods and activities that are typical in society at a given point in time, irrespective of whether they would choose to have these items, even if they could afford them.
The Living Costs and Food Survey , Office for National Statistics collected information on spending patterns and the cost of living that reflect household budgets. It is conducted throughout the year, across the whole of the UK, and is the most significant survey on household spending in the UK.
The Living Costs and Food Survey provides the data for this indicator, which focuses on the proportion of adults who are unable to afford two or more of six items/activities.
The latest available data shows that, in 2019/20, 7.0% of women and 6.0% of men experienced material deprivation. This compares to 8.0% and 8.0% in 2018/19.
Scotland’s score on this indicator is 99. The gender equality score for this indicator was 100 in 2020.
The items/activities are detailed in the ‘methodology’ tab in this section.
% of adults who are unable to afford two or more of the six items/activities, by gender 2018/19 to 2019/20
The Living Costs and Food Survey collects and publishes data by age, disability, ethnicity and religion.
Intersectional data may be available from Scottish Government analysts via ad hoc requests. Some intersectional data, however, may not be able to be disclosed due to small numbers
This indicator measures the percentage of adults who are unable to afford two or more of the six items/activities. The reference population was all adults (16+). The gender equality score was calculated by comparing the value for women with the mid-point of men and women. For consistency, indicator data was reversed before calculating the equality score so that high percentages correspond to the more desirable outcome. See the Methodology chapter for further details.
The Living Costs and Food Survey collects information on spending patterns and the cost of living that reflect household budgets. It is conducted throughout the year, across the whole of the UK, and is the most significant survey on household spending in the UK.
The six items or activities are:
Do you have a small amount of money to spend each week on yourself?
Do you replace worn out clothes with new ones?
Do you regularly participate in a hobby or leisure activity?
Do you have friends or family round for a drink or a meal at least once a month?
Do you have two pairs of properly fitting shoes, including a pair of all weather shoes?
Do you have internet access for personal use at home?
This indicator was previously called ‘Income independence’, however, it has been renamed to ‘Low income’, as this better describes the data, which shows the proportion of adults with an income below 60% of the UK median income, rather than the proportion of adults who had income independence.
Women earn less on average than men (Earnings indicator), are less likely to be paid the Living Wage (Living Wage indicator) and are more likely to not be working due to looking after children or home (Labour market ‘inactivity’ due to caring indicator). This may lead to women having a lower independent income. Whilst there may be income pooling within a couple with a high-income and low-income earner, there will be an unequal reliance on the sharing of income to maintain their standard of living.
The low income indicator measures the proportion of adults with an income below 60% of the UK median income, after equivalising for dependent children living with them. Due to limitations of the available data, we have assumed that costs related to dependent children are shared proportionate to individual income within a family. This indicator uses income before housing costs to avoid needing to make assumptions about how housing costs are split within a couple.
In 2019-22, 31.7% of women had a low independent equivalised income compared to 19.4% of men. These figures are similar to those in 2016-19, however they have decreased slightly for women (32.0%) and increased slightly for men (19.0%).
This gives a gender equality score of 92 in 2023, compared to a score of 91 in 2020.
% of adults with an individual equivalised income less than 60% of median UK income, by gender 2016-19 to 2019-22
Source: Family Resources Survey (FRS)
The FRS collects and publishes data by age, disability, ethnicity and religion.
Intersectional data may be available from Scottish Government analysts via ad hoc requests. Some intersectional data, however, may not be able to be disclosed due to small numbers
Estimates have been derived using data from the Family Resources Survey (FRS) and the Households Below Average Income (HBAI). Individual income data was taken from the FRS, and household data from HBAI. Where household income couldn’t be attributed to an individual this was split proportionately to individual incomes in each family within a household.
Individual income data was equivalised so that it was equivalent to a couple with no children, and then compared to 60% of UK median income. Equivalisation adjusts income to take into account variations in the size and composition of the households in which individuals live. This reflects the common sense notion that, in order to enjoy a comparable standard of living, a household of, for example, an adult with two children need a higher income than a single person living alone. For couples with children, each adult’s individual income was equivalised based on half of the dependent children.
The equivalence scales used here are the modified Organisation for Economic Cooperation and Development (OECD) scales:| Scale Value | |
|---|---|
| Base (household) | 0.33 |
| Adult | 0.33 |
| Child aged under 14 | 0.20 |
| Child aged 14 and over | 0.33 |
It is possible that this data can be further developed in the future to better account for pooling of incomes and living costs.
Information on how couples in Scotland spend their money and make financial decisions was gathered in an online omnibus survey carried out by YouGov between 27 July and 7 August 2023. The sample was 1,148 adults on Scotland living with a spouse or partner of which 593 were women and 555 were men. Note that this represents a change in methodology from the 2020 Gender Equality Index in which data was gathered in the Scottish Social Attitudes Survey (SSA) Intra-household distribution of resources module 2019.
In these surveys, respondents living in couples were asked a series of questions on spending decisions made within households. One such question, designed to gain an insight into control of household spending by gender, asked: “Thinking about you and your partner, who usually makes the decisions for the two of you about how much to spend on large household items such as a TV or a fridge?”. This was thought to be a better indicator of financial control within households than the question in the same module on grocery shopping, which could be influenced more by practical reasons around who does the shopping.
In 2023, 14.5% of women made these decisions compared to 15.1% of men. The remainder can be attributed to couples where both parties make these decisions. In 2019 these figures were 12.6% for women and 14.7% for men.
Scotland’s score on this indicator is 98, up from 92 in 2020.
% of adults living with a partner who responded that they usually make the decisions about how much to spend on large household items, by gender 2019 to 2023
Source: YouGov
Please note that data from 2023 comes from a survey carried out by YouGov, while data from 2019 was sourced from the the Scottish Social Attitudes Survey (SSA) Intra-household distribution of resources module 2019. Respondents in both were asked the same question, however, as the data sources differ in nature, caution is advised when comparing the two figures directly.
No intersectional breakdowns are available for this indicator based on the YouGov omnibus survey.
For the 2019 data, breakdowns are availble in the Scottish Social Attitudes Survey (SSA) Intra-household distribution of resources module 2019 by age, disability and SIMD.
Intersectional data may be available from Scottish Government analysts via ad hoc requests. Some intersectional data, however, may not be able to be disclosed due to small numbers
This indicator measures the percentage of adults living with a partner who responded that they usually make the decisions about how much to spend on large household items. The reference population was adults (16+) living with a partner. The gender equality score was calculated by comparing the value for women with the mid-point of men and women. See the Methodology chapter for further details.
The 2023 data was gathered in a survey carried out by YouGov Plc. The total sample size was 2,015 adults in Scotland, of which 1,088 report that they were living with a spouse or partner. Fieldwork was undertaken between 27th July - 7th August 2023. The survey was carried out online. The figures have been weighted and are representative of all Scotland adults (aged 16+).
The data for the 2020 Gender Equality Index was gathered in the Scottish Social Attitudes Survey (SSA) Intra-household distribution of resources module 2019. Information about the methodology can be found in: (SSAS 2019 technical paper).
Both surveys asked people living in couples:
“Thinking about you and your partner, who usually makes the decisions for the two of you about how much to spend on large household items such as a TV or a fridge?”
Information on how couples in Scotland spend their money and make financial decisions was gathered in an online omnibus survey carried out by YouGov between 27 July and 7 August 2023, which provided an insight into spending and spending restrictions within households in Scotland. The sample was 1,148 adults on Scotland living with a spouse or partner of which 593 were women and 555 were men.
Data for this indicator in the 2020 release was gathered in the Scottish Social Attitudes Survey (SSA) Intra-household distribution of resources module 2019.
In these surveys, respondents living in couples were asked a series of questions on spending restrictions within households. One such question, designed to gain an insight into household spending restrictions by gender, asked: How often do you stay in and not go out because you can’t afford it?
In 2023, 76.8% of women stayed home sometimes because they couldn’t afford to go out compared to 68.1% of men. This is an overall increase compared to when this data was last collected in 2019 but a similar difference between women and men remains; 64.2% of women stayed home sometimes because they couldn’t afford to go out compared to 57.4% of men.
Scotland’s score on this indicator is 84, a slight reduction from 91 in 2020.
% of adults who sometimes stay home instead of going out because they couldn’t afford it, by gender 2019 to 2023
Source: YouGov
Please note that data from 2023 comes from a survey carried out by YouGov, while data from 2019 was sourced from the the Scottish Social Attitudes Survey (SSA) Intra-household distribution of resources module 2019. Respondents in both were asked the same question, however, as the data sources differ in nature, caution is advised when comparing the two figures directly.
No intersectional breakdowns are available for this indicator based on the YouGov omnibus survey.
For the 2019 data, breakdowns are avaialble in the Scottish Social Attitudes Survey (SSA) Intra-household distribution of resources module 2019 by age, disability and SIMD.
Intersectional data may be available from Scottish Government analysts via ad hoc requests. Some intersectional data, however, may not be able to be disclosed due to small numbers.
The 2023 data was gathered in a survey carried out by YouGov Plc. The total sample size was 2,015 adults in Scotland, of which 1,088 report that they were living with a spouse or partner. Fieldwork was undertaken between 27th July - 7th August 2023. The survey was carried out online. The figures have been weighted and are representative of all Scotland adults (aged 16+).
The data for the 2020 Gender Equality Index was gathered in the Scottish Social Attitudes Survey (SSA) Intra-household distribution of resources module 2019. Information about the methodology can be found in: (SSAS 2019 technical paper).
Both surveys asked people living in couples:
“How often do you stay in and not go out because you can’t afford it?”
Personal wealth is one of the key components of women’s and men’s standard of living. Wealth can be used as a source of finance to improve current or future living standards, to invest in opportunities such as education or entrepreneurial activities, and to provide financial resilience, reducing vulnerability to shocks such as unemployment or illness. Many people will try to grow their wealth throughout their working lives, in preparation for retirement, but households with low income and low starting wealth will find this more difficult. People’s personal wealth is made up of their physical, financial, property and pension wealth, with pension wealth the biggest component of them all.
The least wealthy households rarely own property or have any private pension savings. Their wealth is mainly made up of the value of their possessions such as clothing or furniture.
Pensioner couples, married couples, home owners and households with higher formal qualifications tend to be wealthier than other types of households. On the other hand, lone parent households (women account for the vast majority of lone parents), those in social rented housing, or where the head of the household is unemployed or economically inactive but not retired often have below-average wealth. In Scotland’s Gender Equality Index, the indicators included in the money sub-domain of wealth are pensions and savings.
In 2023, Scotland’s gender equality score for the wealth sub-domain is 91.
Wealth inequality in Scotland is monitored within Scotland’s National Performance Framework
Wealth Sub-Domain gender equality scores 2020 to 2023
Pension Wealth is an estimate of the value of wealth held in private (non-state) pension schemes, expressed as an equivalent ‘pot of money’. It comprises occupational and personal pensions and includes the pensions of public sector workers. The estimate is based only on the pension rights accumulated to date and does not include rights which may be built up in future.
The latest Wealth in Scotland report covering the period 2018-2020, shows over time, the proportion of adults with pension wealth (not yet in payment) has been increasing as more and more people are automatically enrolled into workplace pension schemes. The gender gap has been closing.
However in 2018-20, the median pension wealth (not yet in payment as well as in payment) of women was £53,577 compared to £63,163 for men. This compares to £51,700 among women and £100,000 among men in 2016-18.
A drop in the median pension wealth for men is evident in 2018-20. The source publication explains that median pension wealth has decreased in all deciles except for the bottom decile, following a peak in 2016-2018 for the top two deciles. This happened alongside increasing pension participation as more people were automatically enrolled into workplace pension schemes. Hence, the drop may be in part due to new entrants to private pension schemes.
Scotland’s score on this indicator is currently 92, a large increase from a score of 68 in 2020, which likely is due to the notable drop in pension wealth for men and slight increase in pension wealth for women.
Median pension wealth (£), by gender 2016-18 to 2018-20
Source: Wealth and Assets Survey (WAS)
The latest Wealth in Scotland report presents pension wealth data by a range of characteristics education, employment, sexual orientation, marital status, age, religion, ethnicity, disability and sex.
Intersectional data may be available from Scottish Government analysts via ad hoc requests. Some intersectional data, however, may not be able to be disclosed due to small numbers.
This indicator measures the median pension wealth. The reference population was all adults (16+) with pension wealth. The gender equality score was calculated by comparing the value for women with the mid-point of men and women. See the Methodology chapterfor further details.
The methodology used for Wealth and Assets Survey (WAS) is based on the Office for National Statistics’ methodology for the Wealth in Great Britain National Statistics publication series. Further detail on methodology can be found on ONS’s webpages.
The analysis in the Wealth and Assets Survey report is based on data from the Wealth and Assets Survey (WAS), which is a valuable source of information on the economic well-being of households in Great Britain. WAS is managed by the Office for National Statistics.
The survey has a large sample size and almost complete coverage of Great Britain. The sample of private households in Scotland, however, excludes households north of the Caledonian Canal and the Scottish islands. While there are some estimated numbers of households in Scotland included, it should be noted that these numbers are for illustrative purposes only, and may not necessarily be representative of households north of the Caledonian Canal and on the Scottish islands.
WAS is a sample survey and any numbers shown here are estimates only and could be slightly higher or lower if we interviewed a different sample of the population.
Pension Wealth is an estimate of the value of wealth held in private (non-state) pension schemes, expressed as an equivalent ‘pot of money’. It comprises occupational and personal pensions and includes the pensions of public sector workers. The estimate is based only on the pension rights accumulated to date and does not include rights which may be built up in future.
Pension wealth analysis exclude adults with no pension wealth.
It should be noted that this indicator is based on ‘official statistics in development’.
Net savings are calculated as the sum of all financial assets (such as bank accounts, savings accounts, stocks and shares) minus all liabilities (such as overdrafts, loans, credit card debt, and arrears on household bills). These can be formal assets, such as savings accounts or loans from banks, or informal assets, such as money held at home, or borrowing from friends and family. Scotland’s Gender Index uses median net individualised savings.
In 2018-20, the median net savings was £2,600 among women and £2,150 among men. Savings are overall slightly higher than in 2016-18 where the median net savings of women was £1,775 compared to £1,150 for men. Although the median for women is higher in both time periods, men (based on unpublished analysis) had a larger share of aggregated total net savings - this suggests that men’s financial wealth is more skewed, i.e. more unequally distributed, than women’s.
Scotland’s gender equality score for this indicator is 91, an increase from 79 in 2020.
Median individualised net savings (£), by gender 2016-18 to 2018-20
Source: Wealth and Assets Survey (WAS)
The latest Wealth in Scotland report presents savings data by a range of characteristics education, employment, sexual orientation, marital status, age, religion, ethnicity, disability and sex.
Intersectional data may be available from Scottish Government analysts via ad hoc requests. Some intersectional data, however, may not be able to be disclosed due to small numbers.
This indicator measures the median individualised net savings. The reference population was all adults (16+). The gender equality score was calculated by comparing the value for women with the mid-point of men and women. See the Methodology chapterfor further details.
The methodology used for Wealth and Assets Survey (WAS) is based on the Office for National Statistics’ methodology for the Wealth in Great Britain National Statistics publication series. Further detail on methodology can be found on ONS’s webpages.
The analysis in the Wealth and Assets Survey report is based on data from the Wealth and Assets Survey (WAS), which is a valuable source of information on the economic well-being of households in Great Britain. WAS is managed by the Office for National Statistics.
The survey has a large sample size and almost complete coverage of Great Britain. The sample of private households in Scotland, however, excludes households north of the Caledonian Canal and the Scottish islands. While there are some estimated numbers of households in Scotland included, it should be noted that these numbers are for illustrative purposes only, and may not necessarily be representative of households north of the Caledonian Canal and on the Scottish islands.
WAS is a sample survey and any numbers shown here are estimates only and could be slightly higher or lower if we interviewed a different sample of the population.
Financial wealth (net financial wealth) is calculated as the sum of all financial assets (such as bank accounts, savings accounts, stocks and shares) minus all liabilities (such as overdrafts, loans, credit card debt, and arrears on household bills). These can be formal assets, such as savings accounts or loans from banks, or informal assets, such as money held at home, or borrowing from friends and family.
Some financial wealth components (such as endowments attached to repayment of main property mortgage/loan) are held jointly by multiple householders. Following ONS methodology, these were split equally between the household reference person and their spouse/partner.
The median is a measure of the average and is calculated by identifying the exact middle point in a set of observations. When the observations are ranked from lowest to highest, the median is the value in the exact middle of the observed values. It is the Office for National Statistics’ (ONS) preferred measure of average earnings as it is less affected by a relatively small number of very high earners than the mean.
It should be noted that this indicator is based on ‘official statistics in development’.
The ‘Time’ domain of Scotland’s Gender Equality index measures gender inequalities in the allocation of time spent on caring, household and leisure activities. Focusing on time use is important because it demonstrates substantive issues of gender equality and of men’s and women’s comparative life chances, including their capacity to work in the formal labour market, participate in their communities and be healthy.
The ‘Time’ domain has two sub-domains - ‘care’ and ‘time’. The ‘care’ sub-domain is made up of the following three indicators: care of adults, developmental childcare, and non-developmental childcare. The ‘time’ sub-domain is made up of a further four indicators: household management, housework and cooking, social/leisure activities, and volunteering.
In 2023, Scotland’s gender equality score for the ‘Time’ domain is 84, an increase from 78 in 2020. Both of the sub-domains within the ‘Time’ domain saw increases in their gender equality scores, with ‘care’ being slightly less equal than ‘time’:
A gender equality score of 100 represents full gender equality and a score of one represents no gender equality. The higher the score, the more gender equality there is.
Time Domain gender equality scores 2020 to 2023
There has been a change to the scores of Scotland’s Gender Equality Index 2020 following a revision of the data in ONS Time Use Survey: Time Use in Scotland 2020, released in September 2023. Changes to the scores in the Time domain are as follows:
The ‘time’ domain of Scotland’s Gender Equality Index measures gender inequalities in allocation of time spent on caring, household and leisure activities. Focusing on time use is important because it demonstrates substantive issues of gender equality and of men’s and women’s comparative life chances, including their capacity to work in the formal labour market, participate in their communities and be healthy.
Given the gender disparities in time use and the unequal distribution of unpaid work between women and men, data on time spent in paid and unpaid activities are an essential component of gender analysis. Gender equality in paid work is assessed in the ‘Work’ domain of this index.
Time use can be accurately collected by using diary-derived time use information, and this is the method used by the Online Time Use Survey, the main source of data for this chapter.
It should be noted that fieldwork for the 2020 survey took place during the UK’s national lockdown and subsequent periods of restrictions as a result of COVID-19. These restrictions are likely to have had an impact on how time was used in Scotland in 2020, and may have therefore impacted the baseline Time GEI score which was set in 2020. In comparison, fieldwork for the current update was carried out in March of 2023, thus reflecting the post-pandemic period when all public health restrictions were lifted.
There has been a change to the method of statistical analysis used in the Time Use in Scotland 2023 publication, however, this only affects whether the differences in the average spent time on a given activity for men and women are found to be statistically significant but does not have an effect on the calculation of the average time spent on an activity, which is the measure used in the Index.
‘Care’ was selected as a sub-domain within Scotland’s Gender Equality Index to describe the time men and women spend on unpaid care, taking into account traditional societal perceptions that women are more naturally caring than men, and that care work is a woman’s responsibility.
‘Time’ was also selected as a sub-domain within Scotland’s Gender equality index and focuses on the time women and men spend undertaking other unpaid work - household management, housework and cooking, and volunteering- as well as their differences in social/leisure time. Measuring how women and men spend their time in their private lives provides a better understanding of women’s economic and social contributions, and highlights gender inequalities.
It was considered important to separate unpaid caring from other forms of unpaid work by allocating a separate sub-domain, set of indicators and gender equality scores to ‘care’. This was because unpaid caring roles have traditionally fallen to women rather than men, and have particular implications for women in terms of equal access to all spheres of life.
Caring has long been a gendered issue. Rigid gender norms have contributed to the notion that men are ‘breadwinners’ and women are ‘homemakers’, meaning that women are often more likely to take on unpaid care work. Caring roles have significant ramifications for women’s access to employment, career development and progress, access to training and higher education, as well as on physical and mental health.
Caring can be a positive and rewarding experience and can have a positive impact on wellbeing, but it can also be associated with poor psychological wellbeing and physical health (see Carers UK).
The latest estimate puts the number of carers living in Scotland at around 700,000 to 800,000. According to survey data published for Carers Week 2020 by Carers UK the COVID-19 pandemic may have increased the number of people taking on caring roles in Scotland, with 16% of Scottish respondents to Carers UK’s survey stating that they were already providing care before the pandemic, and a further 9% stating they started caring since the coronavirus outbreak.
In Scotland’s Gender Equality Index, the indicators included in the time sub-domain of care are care of adults, developmental childcare and non-developmental childcare.
Using the measures available, in 2023 Scotland’s gender equality score for the care sub-domain is 82. This is an increase from 74 in 2020.
Care Sub-Domain gender equality scores 2020 to 2023
Data for this indicator is taken from the Scottish Health Survey (SHeS). Respondents aged 16+ were asked if they provide any regular help or care for any sick, disabled or frail person.
In 2021, 18.0% of women provided regular care to any sick, disabled or frail person, compared to 13.0% of men. The figures for 2017/18 were similar, with 18.0% of women and 12.0% of men.
In 2023, Scotland’s score on this indicator is 84, this is an increase from a score of 80 in 2020.
% of adults who provide any regular help or care for any sick, disabled or frail person, by gender 2017/18 to 2021
Source: Scottish Health Survey (SHeS)
The Scottish Health Survey (SHeS) found that in 2021 women aged 55-64 were most likely to help or care for any sick, disabled or frail person (27%). This was followed by women aged 45-54 (25%).
Women in the bottom two SIMD quintiles were more likely to be caring for any sick, disabled or frail person than woman in the top three SIMD quintiles. 22% of women in the bottom quintile and 21% in the 2nd quintile had these caring roles, compared to 17%, 14% and 16% of women in the 3rd to 5th quintiles respectively.
Disabled women (defined as a woman with a limiting longstanding illness) and non-disabled women were equally likely to be an unpaid carer. 18% of disabled women provided care for any sick, disabled or frail person, compared to 19% of non-disabled women.
This indicator measures the percentage of adults who provide any regular help or care for any sick, disabled or frail person. The reference population was all adults (16+). The gender equality score was calculated by comparing the value for women with the mid-point of men and women. See the Methodology chapter for further details.
Data for this indicator is drawn from Scottish Health Survey (SHeS) data from 2021. The sample size for this indicator was 4,557 people.
Participants in the SHeS were asked whether they look after, or give any regular help or support to, family members, friends, neighbours or others because of a long-term physical condition, mental ill-health or disability; or problems related to old age. Caring which is done as part of any paid employment is not asked about.
There were two phases of fieldwork for SHeS 2021. During Phase 1, potential participants were contacted by letter and asked to opt-in to taking part in an interview conducted over the phone. This phase began in April, with new invites being sent out each month until September 2021.
Phase 2 began at the end of October, with a new sample issued across three months. Potential respondents were again contacted by letter, but then recruited to participate by interviewers knocking on their door, in what is termed a ‘knock-to-nudge’ methodology. Interviews were still conducted by telephone, as for Phase 1. This second phase only began once COVID-19 restrictions in Scotland had been lifted to the extent that Scottish Government ministers and the Chief Medical Officer gave permission for such doorstep contact to recommence on Scottish Government surveys. The shift to a knock-to-nudge approach significantly increased levels of response to the survey.
The telephone survey methods differed from those used prior to 2020 in the SHeS series. While the 2021 survey includes most of the questions and key indicators from the face-to-face surveys, the change in mode of administration, along with the different approach to sampling, is likely to have impacted the responses received and thus comparability with the previous SHeS data.
The sample in 2021 was drawn from the Postcode Address File (PAF). These addresses comprised three sample types: main (core) sample version A, main (core) sample version B and the child boost screening sample. The data for this indicator is drawn from the main sample - both versions A and B.
Gender norms depicting women as homemakers and men as providers have meant that women have traditionally taken on more childcare roles. In addition, women are far more likely than men to be lone parents.
Developmental childcare includes activities that influence physical, language, thought and emotional changes in children. When considering time spent on developmental childcare in 2020 it is important to note that wave one of fieldwork for the 2020 OTUS took place during the earlier stages of the COVID-19 pandemic, when schools and nurseries were closed for most children (except those whose parents were essential workers) and many parents and carers were required to home school their children - a form of developmental childcare.
In 2023, women with children spent an average of 50 minutes per day on developmental childcare, compared to men with children who spent 40 minutes per day on these activities. In comparison, in 2020 women spent 76 minutes per day, while men spent 53 minutes per day.
It is worth noting that in 2023 both men and women with children spent less time on developmental childcare than in 2020. While causation cannot be established at this point it is possible that this difference is due to changing behaviour during the COVID-19 lockdowns in 2020. Future data will help to establish if the 2023 data is more in line with standard patterns of time use.
In 2023, Scotland’s score on this indicator is 89, an increase on 82 in 2020.
Average minutes per day spent on developmental childcare, adults with children in their household, by gender 2020 to 2023
Source: Time Use in Scotland 2023
Information on how gender intersected with other population characteristics in the 2020 or 2023 OTUS is not currently available. Detailed analysis on how different equality groups in Scotland spent their time in 2020 is available in the 2020 Time Use Survey.
This indicator measures the average minutes per day spent on developmental childcare, adults with children in their household. The reference population was all adults (18+) with children in their household. The gender equality score was calculated by comparing the value for women with the mid-point of men and women. See the Methodology chapter for further details.
The indicator of developmental childcare is made up of both occasions where such childcare was a primary activity, that is when it was the only activity taking place, and time when developmental childcare was a secondary activity, for example looking after the child while they, or you, are doing another activity.
Fieldwork for the OTUS 2023 was carried out between 11 and 19 March 2023. The survey used a representative sample of UK participants selected from the National Centre for Social Research NatCen Panel using a probability-based sampling approach. The Scottish component of the OTUS 2023 drew on the ScotCen Panel (NatCen in the rest of the UK) for responses. This panel is made up of 4,000 people aged 16 and over living in England, Scotland and Wales who were invited to take part after completing the British or Scottish Social Attitudes surveys. The Scottish sample was made up of 453 females (842 diary days) and 399 males (737 diary days). Data was weighted to be representative of the Scottish population, taking into account age, ethnicity, sex, employment. Weighting also factored in differences between weekdays and weekends.
The 2023 OTUS gathered information using pre-coded time use diaries - participants recorded their activities at 10 minute intervals in time use diaries provided by the researchers. They were asked to provide completed diaries on two randomly allocated days which included, by design, one weekday and one weekend day. Diary entries were then recorded by the participants online where possible, or were contacted over the phone by interviewers who recorded diary information on participants’ behalf.
Time is reported in average minutes per day. For the indicator of developmental childcare this average is calculated using only those members of the sample who have children in their household.
It should be noted that this indicator is based on ‘Official Statistics in Development’.
Non-developmental childcare includes activities such as feeding, washing, dressing or preparing meals for children.
In 2023 women with children spent an average of 55 minutes per day on non-developmental childcare, compared to men with children who spent 31 minutes per day on these activities. In comparison, in 2020 women spent 122 minutes per day, while men spent 50 minutes per day.
It is worth noting that in 2023 both men and women with children spent less time on non-developmental childcare than in 2020. While causation cannot be established at this point it is possible that this difference is due to changing behaviour during the COVID-19 lockdowns in 2020. Future data will help to establish if the 2023 data is more in line with standard patterns of time use.
In 2023, Scotland’s score on this indicator is 72. This is an increase on 59 in 2020.
Average minutes per day spent on non-developmental childcare, adults with children in their household, by gender 2020 to 2023
Source: Time Use in Scotland 2023
Information on how gender intersected with other population characteristics in the 2020 or 2023 OTUS is not currently available. Detailed analysis on how different equality groups in Scotland spent their time in 2020 is available in the 2020 Time Use Survey.
This indicator measures the average minutes per day spent on non-developmental childcare, adults with children in their household. The reference population was all adults (18+) with children in their household. The gender equality score was calculated by comparing the value for women with the mid-point of men and women. See the Methodology chapter for further details.
Fieldwork for the OTUS 2023 was carried out between 11 and 19 March 2023. The survey used a representative sample of UK participants selected from the National Centre for Social Research NatCen Panel using a probability-based sampling approach. The Scottish component of the OTUS 2023 drew on the ScotCen Panel (NatCen in the rest of the UK) for responses. This panel is made up of 4,000 people aged 16 and over living in England, Scotland and Wales who were invited to take part after completing the British or Scottish Social Attitudes surveys. The Scottish sample was made up of 453 females (842 diary days) and 399 males (737 diary days). Data was weighted to be representative of the Scottish population, taking into account age, ethnicity, sex, employment. Weighting also factored in differences between weekdays and weekends.
The 2023 OTUS gathered information using pre-coded time use diaries - participants recorded their activities at 10 minute intervals in time use diaries provided by the researchers. They were asked to provide completed diaries on two randomly allocated days which included, by design, one weekday and one weekend day. Diary entries were then recorded by the participants online where possible, or were contacted over the phone by interviewers who recorded diary information on participants’ behalf.
Time is reported in average minutes per day. For the indicator of developmental childcare this average is calculated using only those members of the sample who have children in their household.
It should be noted that this indicator is based on ‘Official Statistics in Development’.
The time sub-domain measures the different ways men and women use their personal time. By measuring how women and men spend their time away from formal work, women’s economic and social contributions can be better understood and gender inequalities highlighted.
How a person spends their leisure time is also vital to their health and wellbeing. Appropriate leisure, social and physical activities all contribute to wellbeing, while an overburden of both paid and unpaid work can cause stress.
In this sub-domain, three forms of unpaid work are considered: household management, housework and cooking, and volunteering, as well as social/leisure activities.
In 2023, Scotland’s gender equality score for the time sub-domain is 87. This is an increase on 82 in 2020, indicating improved gender equality.
Time Sub-Domain gender equality scores 2020 to 2023
Household management is a form of unpaid work which encompasses activities related to household administration - such as banking, errands, appointments, and food and drink shopping.
In 2023, there was no substantial difference in time spent on household management between women and men. Women spent an average of 13 minutes per day on these activities, compared to 10 minutes for men. In comparison, in 2020 both women and men spent more time on household management, with an average of 18 minutes per day for women and 14 minutes for men.
In 2023, Scotland’s score on this indicator is 84, a slight decrease from 2020 when the score was 88.
Average minutes per day spent on household management as a main activity, by gender 2020 to 2023
Source: Time Use in Scotland 2023
Information on how gender intersected with other population characteristics in the 2020 or 2023 OTUS is not currently available. Detailed analysis on how different equality groups in Scotland spent their time in 2020 is available in the 2020 Time Use Survey.
This indicator measures the average minutes per day spent on household management as a main activity. The reference population was all adults (18+). The gender equality score was calculated by comparing the value for women with the mid-point of men and women. See the Methodology chapter for further details.
Fieldwork for the OTUS 2023 was carried out between 11 and 19 March 2023. The survey used a representative sample of UK participants selected from the National Centre for Social Research NatCen Panel using a probability-based sampling approach. The Scottish component of the OTUS 2023 drew on the ScotCen Panel (NatCen in the rest of the UK) for responses. This panel is made up of 4,000 people aged 16 and over living in England, Scotland and Wales who were invited to take part after completing the British or Scottish Social Attitudes surveys. The Scottish sample was made up of 453 females (842 diary days) and 399 males (737 diary days). Data was weighted to be representative of the Scottish population, taking into account age, ethnicity, sex, employment. Weighting also factored in differences between weekdays and weekends.
The 2023 OTUS gathered information using pre-coded time use diaries - participants recorded their activities at 10 minute intervals in time use diaries provided by the researchers. They were asked to provide completed diaries on two randomly allocated days which included, by design, one weekday and one weekend day. Diary entries were then recorded by the participants online where possible, or were contacted over the phone by interviewers who recorded diary information on participants’ behalf.
Time is reported in average minutes per day. For the indicator of developmental childcare this average is calculated using only those members of the sample who have children in their household.
It should be noted that this indicator is based on ‘Official Statistics in Development’.
The housework and cooking indicator includes activities that can be considered as domestic work, for example: making food and drinks, cooking or washing up; cleaning, hoovering, tidying the house, washing up and ironing, washing or mending clothes.
In 2023, women spent substantially more time on housework and cooking than men - an average of 122 minutes per day, compared to 78 minutes for men. This pattern was similar in 2020 when women spent an average of 125 minutes per day, while men spent an average of 72 minutes.
In 2023, Scotland’s score on this indicator was 78, an increase from 2020 when the score was 74.
Average minutes per day spent on housework or cooking as a main activity, by gender 2020 to 2023
Source: Time Use in Scotland 2023
Information on how gender intersected with other population characteristics in the 2020 or 2023 OTUS is not currently available. Detailed analysis on how different equality groups in Scotland spent their time in 2020 is available in the 2020 Time Use Survey.
This indicator measures the average minutes per day spent on housework or cooking as a main activity. The reference population was all adults (18+). The gender equality score was calculated by comparing the value for women with the mid-point of men and women. See the Methodology chapter for further details.
Fieldwork for the OTUS 2023 was carried out between 11 and 19 March 2023. The survey used a representative sample of UK participants selected from the National Centre for Social Research NatCen Panel using a probability-based sampling approach. The Scottish component of the OTUS 2023 drew on the ScotCen Panel (NatCen in the rest of the UK) for responses. This panel is made up of 4,000 people aged 16 and over living in England, Scotland and Wales who were invited to take part after completing the British or Scottish Social Attitudes surveys. The Scottish sample was made up of 453 females (842 diary days) and 399 males (737 diary days). Data was weighted to be representative of the Scottish population, taking into account age, ethnicity, sex, employment. Weighting also factored in differences between weekdays and weekends.
The 2023 OTUS gathered information using pre-coded time use diaries - participants recorded their activities at 10 minute intervals in time use diaries provided by the researchers. They were asked to provide completed diaries on two randomly allocated days which included, by design, one weekday and one weekend day. Diary entries were then recorded by the participants online where possible, or were contacted over the phone by interviewers who recorded diary information on participants’ behalf.
Time is reported in average minutes per day. For the indicator of developmental childcare this average is calculated using only those members of the sample who have children in their household.
It should be noted that this indicator is based on ‘Official Statistics in Development’.
Data for this indicator is drawn from the Scottish Household Survey (SHS) 2021. Respondents were asked if they had provided unpaid help to organisations or groups in the last 12 months.
In 2021, volunteering was slightly more common among women than men, where 28.0% of women had provided unpaid help to organisations or groups in the last 12 months compared to 27.0% of men. This remains unchanged for women in 2021, while the percentage for men has increased slightly from 24.0% in 2019.
In 2023, Scotland’s score on this indicator is 98, an increase from 2020 when the score was 92.
% of adults who provided unpaid help to organisations or groups in the last 12 months, by gender 2019 to 2021
Source: Scottish Household Survey (SHS)
In 2021, women aged 16 to 34 and women aged 35 to 59 were most likely to volunteer (29%), while men aged 16 to 34 were least likely to volunteer. There were not substantial differences between groups, however, with 27% women aged 60+ volunteering in the last 12 months, and 28% of men aged 25 to 59 and men aged 60+.
Those from the ‘White: Other British’ were the ethnic group most likely to undertake volunteering (34%), compared to 28% from the ‘White: Other’ group, 26% from the ‘White: Scottish’ group and 26% from the ‘Minority Ethnic’ group.
Non-disabled people were more likely to volunteer than disabled people (29% versus 23% respectively).
People from less deprived areas were more likely to volunteer than those from the most deprived area. Those in quintile 5 (the 20% least deprived) were most likely to volunteer (33%), and those in quintile 1 (the 20% most deprived) the least likely to volunteer (21%).
Volunteering is more common among those living in rural areas. 33% of those living in remote rural areas had volunteered, compared with 26% of those living in large urban areas. Volunteers living in remote rural or accessible rural areas were more likely to volunteer for local community or neighbourhood organisations/groups (34% and 32% respectively) than the average for all of Scotland (27%).
This indicator measures the percentage of adults who provided unpaid help to organisations or groups in the last 12 months. The reference population was all adults (16+). The gender equality score was calculated by comparing the value for women with the mid-point of men and women. See the Methodology chapter for further details.
The Scottish Household Survey (SHS) is a Scotland-wide face-to-face survey of a random sample of people in private residences. The SHS is voluntary and interviewer-administered in people’s homes. Computer Assisted Personal Interviewing (CAPI) is used to collect the survey data.
The sample size for this question was 9,030. It is worth noting that due to the coronavirus (COVID-19) pandemic, all face-to-face interviewing for the Scottish Household Survey was suspended and replaced with telephone/ video interviewing for both the 2020 survey and the 2021 survey. As a consequence, the results from 2020 and 2021 are not directly comparable to SHS results from previous years. Comparisons can be drawn between results from 2020 and results from 2021, however some differences may be due to seasonal effects, as the 2020 data was collected in October 2020 and January-March of 2021, while the 2021 data was collected over the course of a whole year, between April 2021 and March 2022. The change in methodology has also required a change to the weighting methodology from previous years. For more information see Scottish Household Survey 2021: methodology and fieldwork outcomes.
The domain of knowledge within Scotland’s Gender Equality Index is designed to measure gender equality in education and training. The two sub-domains, exploring the differences between men and women, are educational attainment and subject segregation.
In 2023, Scotland’s score for the knowledge domain is 81, which is an increase from 78 in 2020. There is also a change in the the two sub-domains, where attainment has increased to 96 from 92, and subject segregation has increased to 69 from 65. The low score for subject segregation is driven by the low score for modern apprenticeships (24) due to the low number of women who complete a STEM apprenticeship compared to men.
In both years, attainment was much more gender equal than subject segregation. Women and girls outperformed men and boys on measures of educational attainment in both years, yet this advantage did not translate into higher pay for women graduates.
Knowledge Domain gender equality scores 2020 to 2023
The EIGE domain of knowledge measures gender inequalities in educational attainment and subject segregation. It was agreed by the expert working group that these would also be broadly appropriate sub-domains for the knowledge domain within a Scotland index.
A gender equality score of 100 represents full gender equality and a score of one represents no gender equality. The higher the score, the more gender equality there is.
The first sub-domain of educational attainment is measured by two indicators: a measure of secondary school education attainment, and a measure of university graduates. In addition, it was also felt that it would be valuable to measure whether graduate pay for women and men is in line with their attainment and, therefore, this was also selected as a third indicator.
The second sub-domain looks at gender segregation in secondary and university education by examining the percentage of women and men among students in STEM subjects. Reducing the gender gap in STEM education could help reduce skills gaps, increase women’s employment, and reduce occupational segregation. Ultimately this could foster economic growth via both higher productivity and increased labour market activity. However, it is clear that qualifications alone will not achieve this. Rather, these qualifications have to translate into STEM jobs for women for there to be equality in the labour market.
Scotland has a long tradition of expertise, innovation and achievement in STEM, and it’s an integral part of future economic and social development. The Scottish Government published the STEM Education and Training Strategy for Scotland in 2017. This sets out a vision of Scotland as a STEM nation: with a highly-educated and skilled population equipped with the STEM skills, knowledge and capability required to adapt and thrive in the fast-paced, changing world and economy around us. Increasing the participation of women in STEM subjects will have a strong positive impact on gross domestic product (GDP) and could help close the gender pay gap. It was also thought valuable to consider segregation within Modern Apprenticeships and this was also included as an indicator.
Other areas considered by the expert working group were on gendered bullying in schools and in other educational institutions but suitable data is not yet available in these areas.
Levels of educational attainment and skills development can have a strong impact on a person’s life chances. Without basic skills and with a low level of qualification, adults are at a higher risk of unemployment, poverty and social exclusion. The attainment sub-domain within the knowledge domain of Scotland’s Gender Equality Index consists of three indicators:
secondary education
higher education
the ratio of pay to attainment
All three indicators produced scores of 90 or more, which indicates that attainment levels in Scotland between women (and girls) and men (and boys) were fairly equal. This is because the differences in the underlying data for the three indicators is fairly small, and thus equates to a higher score. It must be noted, however, that the data shows a discrepancy between women’s educational achievements and their compensation. While women (and girls) outperform men (and boys) in both secondary and higher education, five years post-graduation they are paid less than their male peers with the same level of qualifications.
Secondary education attainment was measured as the percentage of girls and boys who attained one or more passes at SCQF level 6 (approximately Scottish Higher) or better. The higher education indicator measured the percentage of women and men aged 25-64 with a higher education qualification. In 2023, both the secondary education and higher education indicators produced scores of 90 or above (93 and 97 respectively) and in both of these indicators women and girls outperformed men and boys. With regard to equality, the goal of course should not be for women and girls to have lower levels of educational attainment to match men and boys, but rather that men and boys should catch up with women and girls in terms of secondary attainment.
The indicator measuring ratio of pay to attainment was developed to show how well women and men’s educational attainment translates into labour market outcomes. The pay of women graduates was lower than the pay of men.
Attainment Sub-Domain gender equality scores 2020 to 2023
Attainment at secondary school can be key to a person’s life chances. Scottish Credit and Qualifications Framework SCQF qualifications can help facilitate access to further and higher education, Modern Apprenticeships and the labour market.
In 2021/22 65.8% of girl school leavers attained at least one pass at SCQF level 6 or better compared to 56.9% of boys. This produced a secondary education attainment score of 93, indicating that gender equality of secondary attainment is fairly high. Compared to 2018/19, the percentage for girls has remained the same (66.8%), while the percentage for boys has increased from 54.5%.
% of school leavers attaining one pass or more at SCQF level 6 or better, by gender 2018/19 to 2021/22
Source: Summary Statistics for Attainment and Initial Leaver Destinations
Breakdowns are available in this data collection as indicated below. Intersectional data may be available from Scottish Government analysts via ad hoc requests. Some intersectional data, however, may not be able to be disclosed due to small numbers.
Summary Statistics for Attainment and Initial Leaver Destinations presents data by SIMD, ethnicity, disability, urban and rural classification, and ASN (Additional Support Needs)
This indicator measures the percentage of school leavers attaining one pass or more at SCQF level 6 or better. The reference population was all secondary school leavers. The gender equality score was calculated by comparing the value for girls with the mid-point of boys and girls. See the Methodology chapter for further details.
Data is taken from Summary Statistics for Attainment and Initial Leaver Destinations.
The Scottish Credit and Qualifications Framework (SCQF) is used as the basis for reporting attainment of one pass or more in National Qualifications at SCQF Level 6 or better. The SCQF is Scotland’s national qualifications framework. The SCQF has 12 levels which, in ascending order, indicate the difficulty of a particular qualification. With reference to a set of ‘level descriptors’ the SCQF allows broad comparisons to be made between qualifications. It also allows learners, employers and the public in general, to understand the range of skills and learning that should be achieved at each level.
Scotland’s Gender Index uses SCQF level 6 or better as the indicator for secondary attainment. This covers Highers (grades A-C), Skills for Work Higher and Advanced Higher (grade D). Highers are generally taken in S5/S6 and Advanced Highers are generally taken in S6. Highers, sometimes along with Advanced Highers, are the Scottish qualifications required for entry into Higher Education. For Highers, grade A-C is considered a pass. A school leaver is defined as a young person of school leaving age who left school during or at the end of the school year. School leavers from 2021/22 are the seventh cohort to have experienced the Curriculum for Excellence (CfE) throughout the senior phase of their school education.
Please note that alternative approaches to certification were in place in 2020 and 2021 due to COVID-19 and that these will have had an impact on attainment levels.
Higher education qualifications are important for their recognition by employers and academics. At university or college, students get the opportunity to develop skills, knowledge, critical thinking and connections to enhance their careers. A higher education qualification can lead to increased access to jobs and higher earning potential.
Scotland’s Gender Equality Index looks at the percentage of women and men aged 25-64 with a higher education qualification. In 2022, 60% of women aged 25-64 were graduates, compared to just over half (56.0%) of men in the same age bracket. This produced a higher education score of 97, indicating that gender equality in higher education qualifications is relatively high. This is an increase from 92 in 2020. In comparison, half of women (51.2%) and just over two fifths of men (43.4%) had a higher education qualification in 2018.
% of adults (aged 25-64) with a higher education qualification, by gender 2015 to 2022
Source: Organisation for Economic Co-Operation and Development (OECD)
Breakdowns are available in this data collection as indicated below. Intersectional data may be available from Scottish Government analysts via ad hoc requests. Some intersectional data, however, may not be able to be disclosed due to small numbers.
Data is taken from the Organisation for Economic Co-Operation and Development (OECD) which highlights the key statistics for Scotland’s labour market. Breakdowns are available in this data collection by age, ethnicity, disability and SIMD.
This indicator measures the percentage of adults (aged 25-64) with a higher education qualification. The reference population was all adults aged 25-64. The gender equality score was calculated by comparing the value for women with the mid-point of men and women. See the Methodology chapter for further details.
Data is taken from the Organisation for Economic Co-Operation and Development (OECD) which highlights the key statistics for Scotland’s labour market. Reliable and up-to-date headline information is presented for key indicators including; employment, equality characteristics of those in employment, underemployment, inactivity and youth participation in the labour market.
Women consistently outperform men in terms of attainment throughout school and higher education, however this does not translate into higher average earning in the labour market. This indicator, the ratio of graduate pay to attainment, was chosen to reflect this in Scotland’s Gender Equality Index.
This indicator uses the newly developed Longitudinal Education Outcomes (LEO) data, which shows the progress of higher education leavers into the labour market. The LEO links education records to tax and benefits data to show if graduates were employed and how much they were paid.
This data source shows the earnings of women to be lower than the earnings of men five years after graduation. Among graduates in 2020/21 women earned on average £29,200 whereas men earned £31,000. This produced a ratio of pay to attainment score of 97. There has been a small increase to the sub-domain score because women’s and men’s earnings have become closer than they were in 2017/18 (£26,600 for women and £29,600 for men), however, the general trend of men earning more than women is still present.
Some of these differences will be due to the differences in part-time working by gender (among other factors such as occupational segregation), however the LEO is currently unable to distinguish between those working full and part-time and this should be borne in mind when looking at the data.
Median total earnings of first degree graduates five years after graduation, by gender 2017/18 to 2020/21
Breakdowns are available in this data collection as indicated below. Intersectional data may be available from Scottish Government analysts via ad hoc requests. Some intersectional data, however, may not be able to be disclosed due to small numbers.
Longitudinal Education Outcomes (LEO): Subject by Provider, 2020-2021 tables breaks data down by disability and SIMD. The former by gender is available in the published tables, and the latter by gender may be available on request.
The UK level report Longitudinal Education Outcomes (LEO): outcomes also presents data by ethnicity.
This indicator measures the median total earnings of first degree graduates five years after graduation. The reference population was all first degree graduates. The gender equality score was calculated by comparing the value for women with the mid-point of men and women. See the Methodology chapter for further details.
Data was taken from tables produced using Scottish LEO data published by the Department for Education in their statistical release: Longitudinal Education Outcomes (LEO): Subject by Provider, 2020-2021 tables
Skills in STEM are the key drivers for growth and innovation in twenty-first century Scotland. To maximise the benefit Scotland can derive from these opportunities, the country aspires to grow and develop its STEM expertise. Scotland’s STEM Strategy sets out aspirations to make sure that its approach to STEM is inclusive and there is equality of access and opportunity to study STEM and pursue STEM jobs and careers.
Subject segregation in both education and employment exacerbates gender inequality and, therefore, is included as a key sub-domain within Scotland’s Gender Equality Index. The proportion of women and men with qualifications and careers in STEM will measure this key aspect of gender equality.
In 2023, the sub-domain of subject segregation score is 69, which is an increase from 65 in 2020.
However, as it was the case in the previous iteration of the Index, there was a large difference between the indicators, with secondary and university education scoring around 90, while gender segregation within Modern Apprenticeships scored a highly unequal 24.
Subject segregation Sub-Domain gender equality scores 2020 to 2023
Scotland’s Modern Apprenticeship (MA) programme provides individuals with the opportunity to secure industry-recognised qualifications while earning a wage. It offers people aged 16 and over the opportunity of paid employment, combined with training at different levels. A Modern Apprentice could be a new team member or an existing employee seeking to increase their capability. Participants build valuable work experience and gain an accredited qualification that is recognised by industry. Graduate Apprenticeships | Skills Development Scotland provide work-based learning opportunities up to Master’s degree level for new and existing employees. They have been created in partnership with industry and the further and higher education sector. The apprenticeships combine academic knowledge with skills development to enable participants to become more effective and productive in the workplace. Foundation Apprenticeships are a work-based learning opportunity for senior phase secondary school pupils. Completion leads to a qualification at the same level of learning as a Higher and can lead to progression into a Modern or Graduate Apprenticeship and these apprenticeships provide a route into the world of work.
Participation rates in STEM subjects provide an indicator of gender segregation within Modern Apprenticeships. The score for the Modern Apprenticeships subject segregation indicator was 24 in 2023, an increase from 18 in 2020, which represents relatively unequal participation in these subjects for women and men. Only 982 women completed a STEM Modern Apprenticeship in 2022/23, compared to 7,504 men. However this is a slight increase from 761 women in 2018/19, with the number of men falling slightly (8,144).
This indicator focuses on Modern Apprenticeships only and it should be noted that subjects within the other types of apprenticeships may have a different gender balance.
Skills Development Scotland (SDS), Scotland’s national skill body, is working with its partners to promote gender equality across National Training Programmes. The SDS Board is responsible for facilitating employer leadership of apprenticeships through the Scottish Apprenticeship Advisory Board (SAAB). A Gender Commission was also set up in response to findings by the Scottish Apprenticeship Advisory Board (SAAB) Group Board, which looked at current trends within apprenticeships and identified a need to provide visible, industry leadership by setting up a commission to address gender imbalance. The Gender Commission have published their report and recommendations which we have formally responded to. We have committed to working in partnership with SDS and SAAB to realise the outcomes of the Gender Commission and will integrate the findings into our reform work to ensure they become embedded in the skills system. The work compliments existing activity on gender segregation in the workplace, although it will be the first of its kind to do so specifically through the lens of apprenticeships and work-based learning in Scotland.
Number of Modern Apprentices completing a STEM apprenticeship, by gender 2018/19 to 2022/23
Breakdowns are available in this data collection as indicated below. Intersectional data may be available from Scottish Government analysts via ad hoc requests. Some intersectional data, however, may not be able to be disclosed due to small numbers.
SDS provides modern apprenticeship data by age, ethnicity and disability.
This indicator measures the number of Modern Apprentices completing a STEM apprenticeship. The reference population was all modern apprentice completers. The gender equality score was calculated by comparing the value for women with the mid-point of men and women. See the Methodology chapter for further details.
Modern Apprenticeships provide a way for businesses to train employees to industry-recognised and agreed standards. The data is compiled by Skills Development Scotland. The Modern Apprenticeship Official Statistics include a main report as well as supplementary tables giving breakdowns by age, framework, local authority, redundancies and various combinations of these.
Participation rates in STEM subjects within Scotland’s schools provide an indicator of gender subject segregation in early life stages. A gender imbalance in school STEM qualifications can continue through university education or modern apprenticeships and into the labour market. Lower rates of women qualifying with STEM subjects can have a negative impact on GDP and widen the gender pay gap.
However, more women than men left school with a STEM qualification at SCQF level or better in 2021/22, where 40.1% of girl school leavers had a STEM qualification at SCQF level 6 (Scottish Higher) or better compared to 34.8% of boys. This shows a slight increase for both girls (39.1%) and boys (33.1%) since 2018/19.
This translated to a secondary education segregation sub-domain score of 93 in 2023, a very slight increase from 92 in 2020.
Scotland’s STEM Strategy aspires to ensure children, young people and adults are encouraged to develop an interest in, and enthusiasm for, STEM that is reinforced throughout their lives. It sets out practical steps to address these goals.
% school leavers with a STEM qualification at SCQF level 6 or better, by gender 2018/19 to 2021/22
Source: Summary Statistics for Attainment and Initial Leaver Destinations
Breakdowns are available in this data collection as indicated below. Intersectional data may be available from Scottish Government analysts via ad hoc requests. Some intersectional data, however, may not be able to be disclosed due to small numbers.
Scotland’s STEM Strategy sets out the need to tackle the gender imbalances and other inequities that exist across STEM education and training, including in relation to race, disability, deprivation and geography. These inequalities are unfair and undermine inclusive economic growth in Scotland.
Summary Statistics for Attainment and Initial Leaver Destinations presents data by SIMD, ethnicity, disability, urban and rural classification, and ASN (Additional Support Needs).
This indicator measures the percentage school leavers with a STEM qualification at SCQF level 6 or better. The reference population was all secondary school leavers. The gender equality score was calculated by comparing the value for women with the mid-point of men and women. See the Methodology chapter for further details.
Summary Statistics for Attainment and Initial Leaver Destinations provides information on the educational attainment and initial destinations of 2021/22 school leavers from publicly funded schools in Scotland.
A gender imbalance in graduates with STEM qualifications is likely to lead to job segregation within the labour market. Lower rates of women graduates in STEM subjects can have a negative impact on GDP and widen the gender pay gap.
Despite more girls than boys leaving secondary school with STEM qualifications, the opposite was true for students in higher education of all undergraduate levels graduating with a STEM qualification. In 2021/22, fewer women graduates (47.0%) attained a degree classification in a STEM subject compared to men (58.9%). Due to a change in subject classification codes in 2019, comparisons between figures published in the previous iteration of the Index and current figures cannot be made.
This translated to a score of 89 for the university education subject segregation indicator in 2023 (an increase from 87 in 2020), which represents a gender imbalance in STEM graduates.
% of graduates with a STEM undergraduate degree, by gender 2018/19 to 2021/22
Source: HESA Student data
% of graduates with a STEM undergraduate degree, by subject area and gender 2021/22
Source: HESA Student data
Breakdowns are available in this data collection as indicated below. Intersectional data may be available from Scottish Government analysts via ad hoc requests. Some intersectional data, however, may not be able to be disclosed due to small numbers.
Higher Education Student Data Scotland collects the personal characteristics of students including their age, disability, ethnicity, religious belief.
This indicator measures the percentage of graduates with a STEM undergraduate degree. The reference population was all undergraduate qualifiers from a Scottish university. The gender equality score was calculated by comparing the value for women with the mid-point of men and women. See the Methodology chapter for further details.
The source for this data is Higher Education Student Data Scotland. Due to a change in subject classification codes in 2019/20, HESA no longer provide direct comparisons between figures for 2018/19 and subsequent years.
Scotland’s Gender Equality Index domain of Power is designed to measure gender equality in decision-making positions across political, economic and social spheres.
The domain of power focuses on the representation of women and men in decision making positions, as there is a general consensus that greater gender balance in positions of power will have a positive effect on gender equality.” (European Institute for Gender Equality)
Scotland’s ‘Power’ domain represents influence and decision making in large institutions rather than at an individual or household level, which is covered by other domains within the Index.
In 2023, Scotland’s gender equality score for the Power domain was 56, up from 44 in 2020. There was a large variation in the gender equality scores for the three sub-domains. The political sub-domain had the highest score at 78, up from 72, with gender equality relatively high for ministerial influence. The economic sub-domain had the lowest equality, with a score of 44, up from 34 in 2020. The social sub-domain saw the largest increase, with a score of 50, up from 34 in 2020.
Power Domain gender equality scores 2020 to 2023
The EIGE domain of power is designed to measure gender equality in decision-making positions across the political, economic and social spheres.
A gender equality score of 100 represents full gender equality and a score of one represents no gender equality. The higher the score, the more gender equality there is.
The EIGE index was the starting point for the discussion around the development of Scotland’s power domain, and it was agreed by the expert working group that the three sub-domains of political, economic and social power broadly provided a sound structure for Scotland’s domain. It was thought that the results should be primarily driven by who makes the decisions, rather than perceptions of who has power. Power was the lowest scoring domain in the EIGE index in 2022, despite improvements since 2005.
It was also agreed by the working group that Scotland’s ‘power’ domain should be about influence and decision making in large institutions rather than at an individual or household level (household level decision making is already covered in other domains).
The set of indicators were discussed, agreed and finalised by the working group and are presented in the main body of this report. It should be noted, however, that unlike the other domains, there is a lack of ‘official’ data sources which are able to inform the chosen power indicators.
The main source for many of the indicators is Engender’s Sex and Power in Scotland 2023 research paper - the information presented in this paper was researched in December and January 2022/23 and represents a snapshot in time. The paper identifies and sets out the limitations of the data that it includes:
“The list of organisations and positions identified in this report is not comprehensive, but is indicative of the current gendered balance of power and decision-making in Scotland. As ever, Scottish-level data is sometimes missing or difficult to find, and not all occupational categories included can be compared like-for-like in terms of organisational scale. The influence and reach of cultural production organisations, for instance, is sizeable and cannot be easily measured. Sample sizes are often small, but still indicate patterns within respective fields. We reference sources and the methodology used to define occupational categories in relevant sections throughout the report.”
The economic sub-domain provides a measure for gender equality in decision-making positions across important economic spheres and looks at the gender balance of the heads of public bodies and large private-sector companies.
Scotland’s 2023 gender equality score for the economic sub-domain was 44. Although still low and far from full gender equality, this represents an increase from 34 in 2020. There was, however, a large disparity in the scores between the two indicators.
Economic Sub-Domain gender equality scores 2020 to 2023
The number of Chief Executive Officers (CEOs) in Scotland’s 50 largest companies was chosen as an indicator to provide a measure of gender equality within business and the private sector. There is a clear-cut business case for women’s leadership and it is widely recognised that greater diversity across management and company boards improves organisational performance and access to resources.
However, progress towards women’s leadership within the private sector in Scotland has been extremely slow. In 2022/23, the vast majority of CEOs of Scotland’s 50 largest companies were men with only 7.0% having a woman as CEO (4 women compared with 46 men). Scotland’s 2023 gender equality score on this indicator is 15, demonstrating considerable inequality.
In addition, Small Business Survey Scotland: 2021 shows that fewer than a quarter of small to medium-sized enterprise (SME) employers were women led.
There are a number of possible reasons for these low gender equality scores including: male-dominated working cultures, onerous working models for senior staff, a lack of flexible working opportunities and quality part-time work, and pregnancy and maternity discrimination, which can all be barriers to women’s career progression.
CEOs of Scotland’s 50 largest private sector companies, by gender 2019 to 2022/23
Source: Sex and Power
This indicator measures the CEOs of Scotland’s 50 largest private sector companies. The reference population was all CEOs. The gender equality score was calculated by comparing the value for women with the mid-point of men and women. See the Methodology chapter for further details.
The main source for many of the indicators is Engender’s Sex and Power in Scotland 2023 research paper - the information presented in this paper was researched in December and January 2022/23. The paper identifies and sets out the limitations of the data that it includes:
“The list of organisations and positions identified in this report is not comprehensive, but is indicative of the current gendered balance of power and decision-making in Scotland. As ever, Scottish-level data is sometimes missing or difficult to find, and not all occupational categories included can be compared like for like in terms of organisational scale. The influence and reach of cultural production organisations, for instance, is sizeable and cannot be easily measured. Sample sizes are often small, but still indicate patterns within respective fields. We reference sources and the methodology used to define occupational categories in relevant sections throughout the report.”
It should be noted that these are not ‘Official Statistics’.
Scotland’s public bodies carry out a range of operational, advisory, regulatory and specialist functions, with varying degrees of independence and funding from central government. These governance bodies set policy, deliver services, administer justice, and safeguard rights across a huge range of areas that impact the lives of men and women. The areas covered include social care, education, training, law enforcement, recourse to justice, housing, the environment, the arts, taxation, pensions and enterprise. It was, therefore, important to have a measure of gender equality in this key sector included in Scotland’s Gender Equality Index.
In 2022/23, the vast majority of the heads of Scotland’s public boards were men with only 36.9% headed by women (84 women compared with 144 men). Scotland’s 2023 gender equality score on this indicator is 74, which represents an increase from 60 in 2020.
It should be noted that in 2019, the Scottish Parliament passed the Gender Representation on Public Boards (Scotland) Bill which sets the quota for women on public boards at 50% in order to redress the overrepresentation of men in strategic positions on public bodies.
This indicator measures the heads of public bodies. The reference population was all heads of public bodies. The gender equality score was calculated by comparing the value for women with the mid-point of men and women. See the Methodology chapter for further details.
The main source for many of the indicators is Engender’s Sex and Power in Scotland 2023 research paper - the information presented in this paper was researched in December and January 2022/23. The paper identifies and sets out the limitations of the data that it includes:
“The list of organisations and positions identified in this report is not comprehensive, but is indicative of the current gendered balance of power and decision-making in Scotland. As ever, Scottish-level data is sometimes missing or difficult to find, and not all occupational categories included can be compared like for like in terms of organisational scale. The influence and reach of cultural production organisations, for instance, is sizeable and cannot be easily measured. Sample sizes are often small, but still indicate patterns within respective fields. We reference sources and the methodology used to define occupational categories in relevant sections throughout the report.”
It should be noted that these are not ‘Official Statistics’.
The sub-domain of Political Power examines the representation of women and men across national and local political institutions in Scotland, including the Scottish Parliament and local councils. The indicators included here are council leaders, Ministers, and Members of the Scottish Parliament (MSPs).
Scotland’s 2023 gender equality score for the political sub-domain was 78, up from 72 in 2020. Using these measures there was more gender equality in politics in Scotland at national than local level.
Political Sub-Domain gender equality scores 2020 to 2023
It was important to include an indicator on local politics, as local political leaders make key decisions about vital services which impact on the lives of everyone in the community, including across education, public transport, leisure facilities, and social care.
In 2022/23, the majority of council leaders were men, with only 26.6% of Scotland’s councils headed by women (8 women compared with 24 men). Scotland’s gender equality score on this indicator is 54, which represents a slight increase on a score of 46 in 2020.
In addition to the council leaders, a larger number of local councillors play an important role in supporting people in their ward through case work, advocating for their residents in disputes, offering advice, and representing their views in various spheres. It is important that these roles are also gender balanced, not only so that decisions take into account a range of perspectives, but also so that women are comfortable approaching leaders in sensitive areas such as healthcare and domestic violence.
Experience of leading a local council can also act as a springboard to standing for Holyrood or Westminster elections and low representation of women at this level can impact on women’s representation at higher levels of government.
This indicator measures the council leaders. The reference population was all council leaders. The gender equality score was calculated by comparing the value for women with the mid-point of men and women. See the Methodology chapter for further details.
The main source for many of the indicators is Engender’s Sex and Power in Scotland 2023 research paper - the information presented in this paper was researched in December and January 2022/23. The paper identifies and sets out the limitations of the data that it includes:
“The list of organisations and positions identified in this report is not comprehensive, but is indicative of the current gendered balance of power and decision-making in Scotland. As ever, Scottish-level data is sometimes missing or difficult to find, and not all occupational categories included can be compared like for like in terms of organisational scale. The influence and reach of cultural production organisations, for instance, is sizeable and cannot be easily measured. Sample sizes are often small, but still indicate patterns within respective fields. We reference sources and the methodology used to define occupational categories in relevant sections throughout the report.”
It should be noted that these are not ‘Official Statistics’.
Scotland has continued to deliver gender balanced cabinets in line with a commitment made by the former First Minister after her election in 2014. This indicator looks at the gender balance of Cabinet Secretaries and Ministers weighted by amount of ministerial influence. In 2023, the women’s proportion of weighted ministerial influence was 55.8% (24 for women compared with 19 for men) with women having more Ministerial influence than men. This has flipped since 2020 where men had slightly more influence at this level of politics. As a result, Scotland’s gender equality score on this indicator is 88, down from 97 in 2020.
Cabinet Secretaries and Ministers, weighted by ministerial influence, by gender 2018/19 to 2023
Source: Scottish Government
This indicator measures the cabinet Secretaries and Ministers, weighted by ministerial influence. The reference population was all Cabinet Secretaries and Ministers. The gender equality score was calculated by comparing the value for women with the mid-point of men and women. See the Methodology chapter for further details.
Data taken from the Scottish Government website - Cabinet and ministers
Special Advisers are not included within the indicator. Ministerial influence was weighted by: 4 - First Minister; 3 - Deputy First Minister & Cabinet Secretary for Finance; 2 - Other Cabinet Secretaries; 1 - Ministers (including Lord Advocate and Solicitor General). Data for the Ministers indicator relates to the Scottish Cabinet and Ministers as of the day of the 2023 Scottish Budget.
It should be noted that these are not ‘Official Statistics’.
In 2022/23, women made up 45.7% of Scotland’s MSPs up from 35.7%. Scotland’s 2023 gender equality score on this indicator is 92, which is up from 72 in 2020.
Political parties within Scotland have made concerted efforts to redress the overrepresentation of men among their elected representatives, with all but one of the major parties adopting some form of gender-balancing mechanisms.
The introduction of quotas for MSPs was a key recommendation in the first report of the First Minister’s Advisory Council on Women and Girls in 2018. Outwith legislative powers, the Scottish Parliament has shown commitment to increasing women’s representation within its structures, which is reflected in the increase of female Committee conveners and the gender balance of the Corporate Body. It should be noted, however, that the membership of the Corporate Body changes on a frequent basis.
This indicator measures the number of MSPs. The reference population was all MSPs. The gender equality score was calculated by comparing the value for women with the mid-point of men and women. See the Methodology chapter for further details.
Data taken from the Scottish Parliament Information Centre SPICE
It should be noted that these are not ‘Official Statistics’.
The domain of health within Scotland’s Gender Equality Index measures gender equality in two health-related aspects: health status and access to health services and social care.
Please note that the Health domain does not measure general health or specific health-related conditions. Moreover, Scotland’s Gender Equality Index also has a separate satellite domain on women-specific healthcare. This domain is designed to measure and understand aspects of health data which are not directly comparable by gender.
Access to health services and social care looks at wellbeing from a wide perspective, taking into account patients’ GP experience and access to social care for those who needed it.
Health status looks at the differences in healthy life expectancy of women and men along with a measure of health risk behaviours (such as smoking and drinking), life satisfaction and mental wellbeing.
In the 2023 Gender Equality Index, Scotland’s score for the health domain is 99. This represents no change from 2020 (99).
A gender equality score of 100 represents full gender equality and a score of one represents no gender equality. The higher the score, the more gender equality there is. A score of 99 is a high score compared to the other domains and indicates strong gender equality for health.
In the 2020 Gender Equality Index, Scotland’s score for the health domain was 99. This was a high score compared to the other domains and indicates strong gender equality for health.
There was little difference between the two sub-domains: with both health access (100) and health status (99) recording scores close to 100.
Health Domain gender equality scores 2020 to 2023
The domain of health within Scotland’s gender equality index measures gender equality in two health-related aspects: health status and access to health services and social care. The expert working group felt it was important that these two areas were reflected in the index.
Access to health services and social care looks at wellbeing from a wide perspective, taking into account patient experience and care needs. It brings together patients’ experience of their GP, which looks at the percentage of respondents who describe the overall care provided by their GP practice as “excellent” or “good” and unmet care needs, which looks at the percentage of respondents who had not had access to social care but felt that they needed it.
Health status looks at various health measures, and brings together healthy life expectancy of women and men along with a measure of health risk behaviours (smoking, drinking, low physical exercise, and obesity), life satisfaction and mental wellbeing.
It should be noted that Scotland’s Gender Equality Index also has a separate satellite domain on women-specific healthcare. This domain is designed to measure and understand aspects of health data which are not directly comparable by gender.
The health status sub-domain gives an indication of physical and mental health and wellbeing, along with behaviours that have an impact on these. It is aimed at identifying any health inequalities between women and men in Scotland and in both 2023 and 2020 each of the four indicator scores were close to 100 indicating relative equality in the health status of women and men.
The health risks score was 99, consistent with a score of 98 in 2020
The healthy life expectancy score was 98, the same as in 2020
The life satisfaction score was 98, consistent with a score of 97 in 2020
The mental wellbeing score was 99, consistent with a score of 100 in 2020
Status Sub-Domain gender equality scores 2020 to 2023
The health risks indicator of Scotland’s Gender Equality Index is based on the percentage of adults with two or more health risk behaviours as measured in the Scottish Health Survey. These behaviours are:
current smoker
harmful drinking
low physical activity
obesity
The proportion of women with two or more risk behaviours in 2019 was 27.0% and the proportion of men was 29.0%, leading to a high gender equality score of 99 for this indicator. This is consistent with the 2020 Gender Equality Index in which the gender equality index for this indicator was 98.
This indicator is also included in Scotland’s National Performance Framework NPF. This indicator can be broken down by age, disability, gender and Scottish Index of Multiple Deprivation. These breakdowns can be viewed on the Equality Evidence Finder.
% of adults with two or more health risk behaviours (current smoker, harmful drinking, low physical activity, obesity), by gender 2016 to 2019
Source: Scottish Health Survey (SHeS)
Breakdowns are available in this data collection as indicated below. Intersectional data may be available from Scottish Government analysts via ad hoc requests. Some intersectional data, however, may not be able to be disclosed due to small numbers.
The Scottish Health Survey (SHeS) asks a number of equality questions that are common across household surveys in Scotland. These cover age, ethnicity, religion, long-term conditions and sexual orientation.
The SSCQ gathers survey responses from identical indicator questions in the Scottish Crime and Justice Survey, the Scottish Health Survey and the Scottish Household Survey into one output.
This indicator measures the percentage of adults that they have not had any care, support or help with everyday living, but feel that they needed it. The reference population was all adults (16+). The gender equality score was calculated by comparing the value for women with the mid-point of men and women. For consistency, indicator data was reversed before calculating the equality score so that high percentages correspond to the more desirable outcome. See the Methodology chapter for further details.
This indicator measures the proportion of adults with two or more health risk behaviours. Health risk behaviours are classed as being a current smoker, harmful drinking, low physical activity and obesity.
The data for this indicator is drawn from a section of the Scottish Health Survey.
The four health risks included in this indicator are:
Current smoker
Drinking above the recommended weekly limit of 14 units per week
Failing to meet the physical activity recommendations of at least 150 minutes of moderately intensive physical activity or 75 minutes vigorous activity per week or an equivalent combination of both
Obesity (having a Body Mass Index of 30 or over)
This indicator is also included in Scotland’s National Performance Framework (NPF).
Healthy life expectancy is the average number of years that an individual is expected to live in a state of self-assessed “good” or “very good” health, based on current mortality rates and prevalence of “good” or “very good” health.
In 2019-21, women spent 75.6% of their life in good health and men spent 78.9%, leading to a high gender equality score of 98 for this indicator. This represents no change in the gender equality score compared to 2020.
The overall life expectancy for women in Scotland was higher in 2019-21 (80.8 years for women vs 76.6 years for men) (NRS).
Proportion of life spent in “good” health, by gender 2016-18 to 2019-21
Source: NRS Healthy Life Expectancy
Breakdowns are available in this data collection as indicated below. Intersectional data may be available from Scottish Government analysts via ad hoc requests. Some intersectional data, however, may not be able to be disclosed due to small numbers.
NRS publish life expectancy and healthy life expectancy estimates by age and SIMD for Scottish areas.
Proportion of life spent in “good” health, by SIMD quintile and gender 2019-21
Source: NRS Healthy Life Expectancy
This indicator measures the proportion of life spent in “good” health. The reference population was people born between 2016 and 2018. The gender equality score was calculated by comparing the value for women with the mid-point of men and women. See the Methodology chapter for further details.
NRS publish life expectancy and healthy life expectancy estimates for Scottish areas.
ScotPHO also present information in this area.
Life satisfaction is measured in the Scottish Health Survey by asking participants to rate, on a scale of 0 to 10, how satisfied they are with their life in general. On the scale, 0 represented “extremely dissatisfied” and 10 “extremely satisfied”.
In 2021, 32.0% of women rated their life satisfaction as 9+ compared to 33.0% of men, leading to a high gender equality score of 98 for this indicator. This is consistent with the 2020 Gender Equality Index; in 2018, 36.0% of women rated their life satisfaction as 9+ compared to 34.0% of men, leading to a high gender equality score of 97 for this indicator.
% of adults rating their life satisfaction as 9+, by gender 2018 to 2021
Source: Scottish Health Survey (SHeS)
Breakdowns are available in this data collection as indicated below. Intersectional data may be available from Scottish Government analysts via ad hoc requests. Some intersectional data, however, may not be able to be disclosed due to small numbers.
The Scottish Health Survey (SHeS) asks a number of equality questions that are common across household surveys in Scotland. These cover age, ethnicity, religion, long-term conditions and sexual orientation.
The SSCQ gathers survey responses from identical indicator questions in the Scottish Crime and Justice Survey, the Scottish Health Survey and the Scottish Household Survey into one output.
% of adults rating their life satisfaction as 9+, by age and gender 2021
Source: Scottish Health Survey (SHeS)
% of adults rating their life satisfaction as 9+, by disability and gender 2021
Source: Scottish Health Survey (SHeS)
% of adults rating their life satisfaction as 9+, by income and gender 2021
Source: Scottish Health Survey (SHeS)
% of adults rating their life satisfaction as 9+, by SIMD quintile and gender 2021
Source: Scottish Health Survey (SHeS)
This indicator measures the percentage of adults rating their life satisfaction as 9+. The reference population was all adults (16+). The gender equality score was calculated by comparing the value for women with the mid-point of men and women. See the Methodology chapter for further details.
Life satisfaction is measured in the Scottish Health Survey (SHeS) by asking participants to rate, on a scale of 0 to 10, how satisfied they are with their life in general. On the scale, 0 represented “extremely dissatisfied”” and 10 “extremely satisfied”. This measure has been used in numerous international surveys. There are no pre-defined cut-off points within the scale to distinguish between different levels of satisfaction. However, a summary measure was used in the SHeS analysis which identified three groups of interest based on the overall distribution of scores in the whole population: people with the highest levels of satisfaction (scores of 9 or 10), people with an average satisfaction level (score 8), and those with below average scores (0-7).
This indicator measures the mean score for women and men on the Warwick-Edinburgh Mental Wellbeing Scale (WEMWBS), a common measure of mental wellbeing.
In 2021, the average score for women on the WEMWBS was 48, the same as the score for men, leading to a gender equality score of 99 for this indicator.
Average scores on the Warwick-Edinburgh Mental Wellbeing Scale (WEMWBS), by gender 2008 to 2021
Source: Scottish Health Survey (SHeS)
Breakdowns are available in this data collection as indicated below. Intersectional data may be available from Scottish Government analysts via ad hoc requests. Some intersectional data, however, may not be able to be disclosed due to small numbers.
The Scottish Health Survey (SHeS) asks a number of equality questions that are common across household surveys in Scotland. These cover age, ethnicity, religion, long-term conditions and sexual orientation.
The SSCQ gathers survey responses from identical indicator questions in the Scottish Crime and Justice Survey, the Scottish Health Survey and the Scottish Household Survey into one output.
Average scores on the Warwick-Edinburgh Mental Wellbeing Scale (WEMWBS), by age 2021
Source: Scottish Health Survey (SHeS)
Average scores on the Warwick-Edinburgh Mental Wellbeing Scale (WEMWBS), by disability 2021
Source: Scottish Health Survey (SHeS)
Average scores on the Warwick-Edinburgh Mental Wellbeing Scale (WEMWBS), by income 2021
Source: Scottish Health Survey (SHeS)
Average scores on the Warwick-Edinburgh Mental Wellbeing Scale (WEMWBS), by SIMD quintile 2021
Source: Scottish Health Survey (SHeS)
This indicator measures the average scores on the Warwick-Edinburgh Mental Wellbeing Scale (WEMWBS). The reference population was all adults (16+). The gender equality score was calculated by comparing the value for women with the mid-point of men and women. See the Methodology chapter for further details.
The source for this indicator is the Scottish Health Survey (SHeS).
This indicator can be broken down by age, gender, Scottish Index of Multiple Deprivation, disability and urban rural classification. These breakdowns can be viewed on the Equality Evidence Finder.
WEMWBS is a scale of 14 positively worded items for assessing a population’s mental wellbeing. Warwick and Edinburgh Universities developed WEMWBS in 2006 to support work to develop Scottish mental health indicators for adults. WEMWBS is suitable for adults aged 16 and above and also for use at a population level in teenagers aged 13 years and over in samples of over 100. A shortened version with seven items - the Short Warwick-Edinburgh Mental Wellbeing Scale (SWEMWBS) - is also available.
More information can be found from Public Health Scotland.
The domain of women-specific healthcare is designed to measure and understand aspects of health data that are not directly comparable by gender. Unlike other domains, this satellite domain does not provide a score based on equality between men and women, but rather analyses specific areas of health data specific to women only. Hence, the figures are not included in the calculation of the main Gender Equality Index
This chapter shows some health challenges that are either unique to, or experienced by women. Regardless, this domain should be considered alongside other domains as it is connected with enduring inequalities in the fields of work, health, money, power, knowledge, violence against women and time.
The sub-domains within the women specific health domain are: termination of pregnancy, IVF waiting times, contraception, and maternal health.
The World Health Organisation (WHO) defines reproductive health as a “state of physical, mental, and social well-being in all matters relating to the reproductive system. It addresses the reproductive processes, functions and system at all stages of life and implies that people are able to have a satisfying and safe sex life, and that they have the capability to reproduce and the freedom to decide if, when, and how often to do so.”
The management of reproductive health is an important element of the majority of women’s lives. Women-specific health is measured in a number of ways which aim to capture the spectrum of reproductive experiences lived by women. This analysis does not cover all aspects of reproductive health but rather highlights some of the main areas for which we have sufficient data, and as guided by our expert working group.
Women’s Health is key priority for the Scottish Government which is why Scotland was the first country in the UK to publish an ambitious Women’s Health Plan in August 2021 and Professor Anna Glasier, OBE was appointed Scotland’s first Women’s Health Champion in January 2023. The Women’s Health Plan sets out actions which aim to address women’s health inequalities by raising awareness around women’s health, improving access to health care for women across their lives, and improving health outcomes for women and girls. The Women’s Health Plan Report on Progress published in January 2023 and our Interim Progress Update 2023 published in August 2023 set out in more detail the progress made since the publication of the Plan.
This domain shows that some unique heath challenges are experienced by women in different ways. The main objective of this section is to highlight health experiences which are less comparable by gender, but key to understanding gender equality.
Unlike other domains, this satellite domain does not provide a score based on equality between men and women, but rather analyses areas of health data specific to women only. Regardless, this domain should be considered alongside other domains as it is connected with enduring inequalities in the fields of work, health, money, power, knowledge, time and violence against women and girls. The sub-domains within the women specific health domain are: termination of pregnancy, IVF waiting times, contraception, and maternal health.
For this domain we make use of public health data: as reported by medical professionals and, in the case of the maternal health, provided by women themselves.
In 2021, of the seven statutory grounds for termination, the vast majority (13,565; 99%) were carried out under Ground C; because “the pregnancy has not exceeded its 24th week and that the continuance of the pregnancy would involve risk, greater than if the pregnancy were terminated, or injury to the physical or mental health of the pregnant woman.”
In recent years, the Scottish Government has granted ministerial approvals regarding the provision of terminations of pregnancy in Scotland, allowing both mifepristone and misoprostol (the drugs used in a medical termination) to be taken at home. An evaluation into early medical abortion at home was published in 2023, confirming that early medical abortion at home (EMAH) is effective. In 2022, over 80% of medical abortions in Scotland involved self-administration of one or both medications in the home setting.
On 22 March 2023, the Scottish Government published an evaluation on the safety and efficacy of the current EMAH arrangements and confirmed that the current arrangements will continue, allowing women to take both abortion medications at home up to 12 weeks following a telemedicine consultation.
Of the medical terminations carried out in 2023, 56.2% (9,326) were for both drugs taken at home, 25.5% (4,226) were for the second drug only at home, and 17.1% (2,840) were for medical terminations carried out in the clinic or hospital setting.
The rate of terminations in Scotland in 2022 was 16.1 per 1,000 women aged 13 to 44. The number of terminations undertaken in 2022 was 16,596, an increase from the 13,985 terminations undertaken in 2020 (more detail on change over time is available in the source publication).
The charts below show termination rates by SIMD quintile and by age.
Number of terminations by age 2022
Source: Public Health Scotland (PHS)
The highest number of terminations in 2022 were seen for the 20-24 age group (4,481 terminations), while the lowest number of terminations were seen for the oldest and youngest age groups: 40+ (697 terminations), and 16 and under (114 terminations). The same pattern was true for 2019, with 3,929 terminations terminations in the 20-24 age group, 581 terminations for 40+ and 135 terminations for 16 and under. A general increase in the number of terminations for 2022 compared to 2019 is also evident from the data.
Further analysis according to deprivation is available in the source publication.
An abortion can be induced (therapeutic) or spontaneous (miscarriage). An induced abortion can be performed either medically (using approved drugs) or surgically. This data reports on induced (therapeutic) abortions only. Induced abortions are referred to as terminations of pregnancy to avoid confusion with spontaneous abortions (miscarriages).
There is a legal requirement to notify the Chief Medical Officer (CMO) of all terminations carried out in Scotland. Public Health Scotland (PHS) is responsible for the collation of data derived from notifications of abortions on behalf of the CMO in Scotland.
PHS provides an annual update on Termination of Pregnancy Statistics. This data is derived from the Notifications of Abortion to the Chief Medical Officer for Scotland (CMO) under the Abortion (Scotland) Regulations 1991. Information is provided by age, gestation, method of termination, NHS Board of residence and treatment, deprivation area, previous termination and ground(s) for termination.
There are seven statutory grounds for termination of pregnancy (Grounds A to G) and at least one must be recorded on every notification form. Occasionally, notifications may record more than one statutory ground resulting in the numbers and percentages of grounds exceeding the total number of terminations.
As in previous years, the vast majority of terminations (13,365; 98%) were carried out under Ground C (because “the pregnancy has not exceeded its 24th week and that the continuance of the pregnancy would involve risk, greater than if the pregnancy were terminated, or injury to the physical or mental health of the pregnant woman.”)
This data is generally considered to be of a high quality, although occasional omissions and administrative errors in submitting notification forms can occur, and may lead to some underreporting.
2019 data is provisional.
Further information on data quality is available in the source publication.
Number of terminations by SIMD quintile 2022
Source: Public Health Scotland (PHS)
In 2022 the number of terminations was associated with deprivation area. In the most deprived quintile there were 4,744 terminations terminations, while in the least deprived quintile there were 2,219 terminations terminations. The same was true in 2019, when the most deprived quintile saw 3,993 terminations terminations, while in the least deprived quintile this number was 1,779 terminations.
In vitro fertilisation (IVF) is an effective method of assisted reproductive technology used to treat infertility
The Scottish Government requires NHS Scotland to measure the length of time people wait for treatment. The target is that 90% of eligible patients will begin IVF treatment within 12 months. The 90% standard continues to be met since it was first measured in March 2015.
As a result of the COVID-19 (Coronavirus) pandemic, Scottish IVF Centres collectively agreed not to start any new treatment after 17 March 2020. In May, permission to restart services was granted by the Human Fertility and Embryology Authority (HFEA). IVF Centres began a stepped restart in line with the framework for restarting fertility services. This impacted waiting times in the months to September 2020, as shown in the below chart.
Number of patients referred, seen and waiting January 2019 - December 2022
Source: Public Health Scotland (PHS)
In December 2022, 666 eligible patients were waiting for an IVF screening appointment, a decrease from 785 patients in 1905. Furthermore, only 77 of eligible patients were referred for treatment in 44896, a slight decrease from 79 in 2020, while 92 patients were seen, a decrease from 105 in 2020.
This chart shows that there was a drop in referrals and patients who have been seen from March 2020, and a corresponding rise in the number of eligible patients waiting for screening. However, referral rates from July 2020 have been steady, and this has also been the case for patients being seen. There has been a decline in the number of patients waiting to be seen between July 2020 and December 2022, but numbers remain higher than in early 2019.
Due to the initial pausing of services and reduction in referrals during the COVID-19 pandemic, the distribution of patients in respect of how long those still waiting to be screened had waited had changed quite considerably: further details on waiting times are available in the source publication.
IVF data is collected and presented at IVF Centre and NHS Board level. A more detailed breakdown by equality characteristics is not available.
Data requests can be made at to Public Health Scotland.
IVF is an effective method of assisted reproductive technology used to treat infertility. This includes intra-cytoplasmic sperm injection (ICSI) for male infertility.
Where PHS refers to IVF, this includes IVF and ICSI. One full cycle of IVF includes ovulation induction, egg retrieval, fertilisation, transfer of fresh embryos, followed by freezing of suitable embryos and subsequent replacement of these provided the couple still fulfill the access criteria.
The Scottish Government requires NHS Scotland to measure the length of time people wait for treatment. The target is that 90% of eligible patients will begin IVF treatment within 12 months. This is measured by the percentage of patients who were screened at an IVF Centre within 12 months of referral from a secondary care/acute consultant. The Scottish Government set this target from 31 March 2015 and it is now a Local Delivery Plan (LDP) standard.
Public Health Scotland reports on how long eligible patients waited from referral to screening appointment for in vitro fertilisation (IVF) treatment by the NHS in Scotland.
Long-acting reversible contraception (LARC)
In typical use, ‘long acting’ methods of contraception, e.g. the contraceptive implant, intrauterine system (IUS), and the intrauterine device (IUD), have a lower failure rate than alternative reversible methods, such as the contraceptive pill or condoms.
Key findings from the source publication include the following:
the LARC prescribing rate increased from 32.1 to 50 per 1,000 women between 2020/21 and 2021/22 as services continued to recover from wider impacts of the COVID-19 pandemic
the contraceptive implant remained the most common type of LARC prescribed with rates of 23.4 per 1,000 women compared to 20.3 and 6.3 for the IUS and IUD respectively
of prescriptions given where the patient’s age was known, those under 35 were more likely to be prescribed the contraceptive implant while those aged 35 and over were more likely to be prescribed the IUS
The below charts show the combined rates of long acting reversible contraception by age and by deprivation rate, per 1000 women aged 15-49.
In 2021/22 the group prescribed long-acting reversible contraception (LARC) was 20-24 year old with 53 per 1,000 women being prescribed. This was a decrease from 60 per 1,000 women in 2019/2020. The second most-prescribed group was 45+ with 44 per 1,000 women, which has increased from 39 per 1,000 women since 2019/2020. In 2021/22 the age group prescribed LARC least often was the 40-44 year olds with 35 per 1,000 women (unchanged from 2019/2020), which was lower then the youngest group of under 20. Nonetheless, there has been a notable decrease in the number of women under 20 who were prescribed LARC in 2021/22 (39 per 1,000 women) compared to in 2019/2020 (51 per 1,000 women).
Number of women per 1,000 prescribed long-acting reversible contraception, by age 2019/20 to 2021/22
Source: Public Health Scotland (PHS)
In 2022 the rates of LARC were similar across deprivation levels, however, they were slightly lower in the least deprived area than in the other areas with and in the most deprived area. This is a slight reduction in numbers from 2019/2020 when there were 40 per 1,000 women in the least deprived area and 44 per 1,000 women in the most deprived area.
Number of women per 1,000 prescribed long-acting reversible contraception, by SIMD quintile 2022
Source: Public Health Scotland (PHS)
Public Health Scotland reports on the prescribing rate of long acting reversible contraception (LARC) to women of reproductive age (15-49) in primary care and sexual health settings.
This data on contraception includes the contraceptive implant, IUD and IUS. Contraceptive injections are also reported on in the source publication (at around 24 per 1000 women of reproductive age) but are presented separately. As multiple contraceptive injections are required per year it is difficult with the current information to determine person level data.
The Maternal Health Sub-Domain reports on health risks for pregnant women along with self-assessed physical health before, during and after pregnancy.
Maternal Smoking
In 2022, 11.9% of expectant women were current smokers at the time of their antenatal booking appointment, this is decline on 14.6% in 2019. A further 13.3% were former smokers at the time of their first appointment, whilst 74.8% had never smoked.
This is a slight increase on 2019, when 12.1% of expectant women were former smokers, and 73.2% had never smoked.
This is a continuing downward trend. Wider policies to control tobacco use, e.g. banning smoking in public places, are likely to have had an impact on the number of women smoking both before and during pregnancy.
Age
Whilst the level of smoking amongst women has fallen steadily across all age groups, women aged under 25 years were considerably more likely to be a current smoker at their booking than women aged 30 and over. Of pregnant women aged under 20, 28% smoked at the time of their booking and the same was true for 20% of pregnant women aged 20-24. Of those aged 30 and over, 9% smoked and the figure was the same for pregnant women aged 40+.
The high percentage of smokers among the under-20s is particularly notable. This may be partly due to teenage pregnancies being more common in disadvantaged areas where smoking rates are highest.
SIMD
SIMD is the Scottish Government’s official measure of area-based multiple deprivation.
There is a strong association between the deprivation category recorded for mothers and their recorded smoking status. In 2022, a higher percentage of women were recorded as smoking during pregnancy in more deprived areas: 22% in the most deprived SIMD quintile compared with 3% in the least deprived quintile.
Ethnicity
In 2022, ‘white’ pregnant women were more likely to be current smokers (14%), while ‘Mixed or multiple’ ethnicity pregnant women were slightly more likely to be former smokers (16% compared to 15% of ‘white’ pregnant women), and ‘Asian, Asian Scottish or Asian British’ pregnant women were the most likely to have never smoked (97%).
Please note that these figures were previously published in Births in Scotland and data for 2019 or earlier can be found there.
Smoking during pregnancy can cause serious health problems for both mother and baby. These include: complications during labour and an increased risk of miscarriage, premature birth, stillbirth, low birthweight and sudden unexpected death in infancy. Given the maternal and foetal risks associated with smoking during pregnancy, pregnant women are strongly advised not to smoke. Known risk factors for smoking during pregnancy include young maternal age and lower socioeconomic status.
Information on smoking behaviour in pregnancy is collected as part of Public Health Scotland’s SMR02 data scheme. The information presented here refers to smoking history recorded when a woman attends her first antenatal booking appointment. Concerns have been raised about the completeness and quality of the SMR02 data, particularly in relation to the number/percentage of pregnant women whose smoking status is recorded as “not known”. Some of these women may, in fact, be smokers. As such, the percentage recorded as current smokers may underestimate the true smoking prevalence among pregnant women. Care should, therefore, be taken when interpreting this data.
The 2016 version of SIMD is used when discussing deprivation.
Maternal Body Mass Index (BMI)
Monitoring the BMI of expectant mothers is important because obesity in pregnancy is associated with an increased risk of a number of serious adverse outcomes, including miscarriage. There is also a higher caesarean section rate and lower breastfeeding rate in this group of women compared to those with a healthy BMI. There is even evidence to suggest that obesity may be a risk factor for maternal death. Increasing maternal age and deprivation are both known to be risk factors for a higher maternal BMI.
In Scotland the BMI of expectant mothers has gone up slightly in 2022 compared to 2019. Of women delivering, 2.3% were ‘underweight’ (compared to 2.8% in 2019). There was also a lower proportion of women with ‘healthy’ BMI (40.9% compared to 44.5%), a slightly larger proportion were ‘overweight’ (29.6% compared to 27.9%), and a slightly larger proportion were ‘obese’ (27.3% compared to 24.8%).
Age
In line with other countries, the risk of having too high a BMI varied by maternal age in Scotland in 2022, with older women tending to be more overweight. The proportion of women who were overweight or obese ranged from 41% in women under 20 years old to 62% in women who were aged 40 and over. There has been a gradual increase in the proportion of overweight and obese women in all the age groups in the past five years.
SIMD
In 2022, the relationship between maternal BMI and deprivation continued to be seen in Scotland. The proportion of women who were overweight or obese at the time of their antenatal booking ranged from 49% in the least deprived areas to 61% in the most deprived areas.
BMI rates
Below 18.5 - Underweight
Between 18.5 and 24.9 - Healthy
Between 25 and 29.9 - Overweight
30 or more - Obese
Mother’s height and weight have been mandatory data items on SMR02 since April 2011 and are recorded at the antenatal booking appointment. Where a height or weight was not available or either value was considered to be an outlier, the BMI was categorised as “unknown”.
The outliers are:
Weight less than or equal to 35kg or greater than or equal to 250kg.
Height less than 1m or greater than or equal to 2.2m.
Data quality for maternal BMI in Scotland has been generally good until recent years. Recording improved markedly from 2013/14 onward as the proportion of those women recorded with an unknown BMI dropped.
Maternity Care Survey
The Maternity Care Survey was a postal survey which was sent to a random sample of women who had a baby in February or March 2018. The survey asked about women’s experiences of maternity services, from antenatal care through to postnatal care at home. For our purposes we look in more detail at women’s self-assessed health: both physical and mental. Women were asked to rate their health before, during and after pregnancy using one of the following categories: “very poor”, “poor”, “fair”, “good”, or “excellent”. The charts below show the proportion of women who rated their heath positively (“excellent” or “good”).
As well as Physical and Mental Health, the Maternity Care Survey reports findings on Midwife-led Units, Neonatal Care, Feeding, and Postnatal Care at Home and in the Community.
It should be noted that the data presented in this indicator is unchanged since the publication of Scotland’s baseline Gender Equality Index in 2020, as 2018 is the last point at which the Maternity Care Survey ran, and caution should therefore be applied when considering these figures against the other maternal health figures presented.
% of women rated their physical health as ‘excellent’ or ‘good’ 2018
Source: Maternity Care Survey
In 2018, 92.0% of women rated their physical health as “excellent” or “good” before pregnancy. This decreased to 70.0% when asked about their physical health during pregnancy. Thinking about their physical health during pregnancy, 79.0% of women responded “excellent” or “good”.
No publications have been released on intersectionality using this data. Furthermore, limited data is collected on equalities as the Maternity Care Survey has a relatively small sample size and there are too few responses to many of the equalities questions asked.
Ad-hoc analyses can be requested from this mailbox.
The Maternity Care Survey was a postal survey which was sent to a random sample of women who had a baby in February or March 2018. This was the third iteration of the survey, following on from the first run in 2013 and the second run in 2015. The survey asked about women’s experiences of maternity services, from antenatal care through to postnatal care at home.
The survey programme supports the three quality ambitions of the 2020 Vision - Safe, Effective, Person-centred - by providing a basis for the measurement of quality as experienced by service users across Scotland. In particular the surveys support the person-centred quality ambition which is focused on ensuring that care is responsive to people’s individual preferences, needs and values.
Just over 2,000 women who gave birth in Scotland in February or March 2018 responded to the 2018 Maternity Care Survey.
Women eligible to be sampled for the survey were those who gave birth in Scotland in February or March 2018 and were aged 17 or over at that date. In total, 5,064 surveys were sent to eligible respondents and 2,049 were returned completed, giving an overall response rate of 40%.
The figures used in this domain are unweighted.
More information about the survey design, response rates and methodology can be found in the Technical Report.
Mental Health
% of women rated their mental health as ‘excellent’ or ‘good’ 2018
Source: Maternity Care Survey
A similar pattern was seen in responses about emotional/mental health. However the decrease during pregnancy was smaller, only dropping to 80.0% per cent from 91.0% before pregnancy. Thinking about their emotional/mental health during pregnancy, 82.0% of women said that it was “excellent” or “good”.
The domain of violence against women is designed to measure the level of violence against women in Scottish society. Similar to the EIGE (European Institute for Gender Equality) Gender Equality Index, the violence against women domain exists here as a satellite domain and does not contribute to the overall Index score. Here, the focus is on the eradication of violence against women rather than its equivalence to men. Nevertheless, violence against women must be considered alongside other domains as it reflects enduring inequalities in the fields of work, health, money, power, knowledge and time.
The sub-domains within the violence against women domain are partner abuse, sexual harassment and victimisation, disclosure, femicide and safety. Compared to the data included in this domain in 2020:
the sub-domain of partner abuse shows no change in the percentage of women who had experienced partner abuse in the 12 months preceding the survey
the sub-domain of sexual harassment and victimisation shows no change in the percentage of women who had experienced stalking or harassment or more serious assault
the sub-domain of disclosure shows that women are most likely to tell an individual about an experience of partner abuse or forced sexual intercourse, more so than support services, health professionals, or social services, which was the same in 2020. However, in 2023, women are more likely to tell criminal justice professionals about their experience compared to women in 2020 and considerably less women in 2023 are reporting they have not told anyone about their experiences compared to 2020
the sub-domain of femicide shows an increase in women being the victims of homicide by a partner/ex-partner
the sub-domain of safety shows that more men than women feel safe walking alone in the local area after dark, a trend that has been unchanged since the start of the time series in 2008/09, but a higher proportion both men and women to report feeling safe over time
What is evident from this domain is that, while Scotland is taking important steps to eradicating violence against women through the Equally Safe strategy adopted in 2014, there have been some improvements in the indicators used in this domain, violence continues to occur. The violence that is taking place is also having lasting effects on women, both psychologically and physically. Estimates about the extent of violence occurring may be hampered by low disclosure rates, especially to criminal justice professionals/police. Importantly, feelings of safety have increased over the last 10 years, with more women feeling safe walking alone in their local area after dark. Nonetheless, the number of women who feel safe remains low in comparison to men.
The satellite domain of violence against women within Scotland’s Gender Equality Index is designed to measure the levels of violence against women in Scottish society. Unlike other domains (except women-specific health), this satellite domain does not provide a score based on equality between men and women, but rather it presents women’s experiences of violence. The main objective is to eliminate violence against women in Scotland, not to reduce gaps between the violence experienced by men and women.
The Scottish Government adopts a broad definition of violence against women and girls which ties in with the United Nations Declaration on the Elimination of Violence Against Women. Violence against women and girls refers to a range of actions that harm, or cause suffering and indignity to women and children, including:
physical, sexual and psychological violence in the family, general community or institutions. This includes domestic abuse, rape, incest and child sexual abuse
sexual harassment and intimidation at work and in public
commercial sexual exploitation, including prostitution, pornography and trafficking
so-called ‘honour based’ violence, including dowry-related violence, female genital mutilation, forced and child marriages and ‘honour’ crimes
The Scottish Government takes a gendered analysis of violence against women, recognising that it is:
caused by the fact that men and women are not equal, and in turn
causes inequality between women and men
The elimination of violence against women is, therefore, vital to achieving gender equality in Scotland. To this end, the Scottish Government introduced the Equally Safe strategy in 2014, updated in 2016 and will be refreshed again in December 2023. It aims to prevent and eradicate violence against women and girls by producing a framework for change across four overarching priorities:
Scottish society embraces equality and mutual respect, and rejects all forms of violence against women and girls
women and girls thrive as equal citizens: socially, culturally, economically and politically
interventions are early and effective, preventing violence and maximising the safety and wellbeing of women, children and young people
men desist from all forms of violence against women and girls and perpetrators of such violence receive a robust and effective response
Equally Safe recognises the importance of intersectionality and focuses on the fact that along with their gender, women and girls have other protected characteristics that increases their level of risk of experiencing violence and abuse. Drivers for this are often the continuing prejudice and structural barriers in society which cause inequality. These protected characteristics include: age, disability, gender reassignment, marriage and civil partnership, pregnancy and maternity, race, religion and belief and sexual orientation.
Furthermore, the Scottish Government is committed to the Programme for Government to legislate to implement the recommendations for criminal law reform contained in the report of the Working Group chaired by Baroness Helena Kennedy KC published in March 2022. The report made 4 recommendations for reform of the criminal law. Following a consultation considering the recommendations in the report led to a conclusion that the proposed offence of ‘public misogynistic harassment’ could best be implemented as two separate offences, one of ‘misogynistic harassment’ and one of ‘misogynistic behaviour’. In September 2023, the First Minister, Humza Yousaf MSP, confirmed that the Scottish Government will bring forward a Bill to implement the recommendations of the working group chaired by Baroness Helena Kennedy, informed by the responses to the recent consultation, to create new criminal laws to address misogynistic harassment and abuse. This is reflected in the legislative programme as set out in the Programme for Government.
The first sub-domain is partner abuse, which is measured by two indicators: the incidence of partner abuse, both psychological and physical, and the severity of this abuse.
The second sub-domain is sexual harassment and victimisation, which is measured by the incidence of harassment and stalking, as well as the incidence of serious sexual assault.
The third sub-domain is disclosure, which is measured by two indicators: the disclosure of forced sexual intercourse and the disclosure of partner abuse.
The fourth sub-domain is femicide and is measured using data on the rate of femicide using homicide statistics.
The final sub-domain is safety, and this is measured by women’s perceptions of their safety when walking alone at night.
Partner abuse, or domestic abuse as it is commonly known, is defined as any form of physical, non-physical or sexual abuse, which takes place within the context of a close relationship, committed either in the home or elsewhere. This relationship will be between partners (married, co-habiting or otherwise) or ex-partners. The term ‘partner abuse’ has been used in Scotland’s Gender Equality Index in order to maintain consistency with the Scottish Crime and Justice Survey (SCJS), the main data source for this satellite domain.
In this context, partner abuse can be considered as falling into two categories – psychological and physical. Psychological abuse is commonly known as coercive control, and was made illegal by the Domestic Abuse (Scotland) Act 2018. Coercive control is a pattern of degrading treatment over time - it can include humiliation, intimidation and other forms of emotional and psychological abuse - that is used to harm, punish or frighten a partner/ex-partner.
Partner abuse is a prevalent form of violence against women, with the World Health Organisation (WHO) estimating that worldwide almost a third (30%) of women who have been in a relationship have experienced some form of physical and/or sexual violence by their intimate partner in their lifetime.
The partner abuse sub-domain within the violence against women domain of Scotland’s Gender Equality Index consists of two indicators: the incidence of partner abuse, and the severity of this abuse. The incidence of partner abuse is measured as the percentage of women who had experienced partner abuse (psychological or physical) in the previous 12 months, and severity was measured using data on the percentage of women who have experienced at least one type of psychological and/or physical effect as a result of partner abuse in the last 12 months. These measures are both respondents’ self-reported views of incidents.
The below chart shows the latest data available on the level of partner abuse in Scotland and change over time. In 2018-20 the percentage of women who had experienced partner abuse (psychological or physical) in the previous 12 months was 3.7%. This is similar to 2016-18 when the figure for women who had experienced partner abuse in the previous 12 months was 3.6%.
It should be noted that these statistics may underestimate the incidence of partner abuse as some women may not feel comfortable disclosing that they have experienced partner abuse. These issues are covered in more detail in the disclosure sub-domain.
% of women who had experienced partner abuse (psychological or physical) in the previous 12 months 2008/09 to 2018-20
Equally Safe recognises that in some minority ethnic communities traditional gender roles can be stronger and cultural practices involving violence, such as forced marriage, more prevalent. In addition, disabled women and girls are more at risk of exploitation and coercion and may be being cared for by an abuser. Older women may be either caring for, or being cared for by, their abuser.
Equally Safe recognises that lesbian, bisexual and transgender women experience violence and abuse that targets their sexual orientation, gender identity or both; homophobia, biphobia and transphobia can drive (or be used as components of) abuse by perpetrators.
Equally Safe recognises that young women disproportionately experience intimate partner violence in relation to young men, and report much greater negative impacts as a result. Evidence from the the Scottish Crime and Justice Survey (SCJS) indicates that younger women (aged 16-24) are more likely than any women of any other age to have experienced partner abuse (9.9% compared to 3.6% of all women).
Data for this indicator comes from the Scottish Crime and Justice Survey (SCJS). Specifically it is drawn from the self-completion element of the survey. The sample size for this element was 6,549 in the combined years 2018-20.
The questionnaire is completed by respondents on the interviewer’s tablet PC (Computer Assisted Self-completion Interviewing -CASI). This ensures confidentiality when answering sensitive questions or those on illicit behaviour.
Data completed within the self-completion element of the SCJS in 2018/19 and 2019/20 has been collated to increase the sample size, and is published biennially. The 2019/20 SCJS publication contains combined 2018/19 and 2019/20 self-completion data.
The definition of partner abuse is not introduced at the start of the SCJS and the terms ‘partner abuse’ or ‘domestic abuse’ are not used in the survey until the final question of the section. Rather, respondents are asked to identify which, if any, of a list of psychological and physical abusive behaviours they have experienced since the age of 16, and in the 12 months prior to interview.
It is worth noting that the partner abuse questions of the self-completion section of the SCJS do not ask whether offenders were in Scotland or not, therefore potentially some incidents which were perpetrated, or occurred, outwith Scotland (including online) may be included in the data.
SCJS is the most comprehensive survey of public experiences and perceptions of crime in Scotland. For further details see the latest Scottish Crime and Justice Survey publication.
Alongside the level of partner abuse in Scotland, it is important to also measure the severity of that abuse. Severity measures the effects of partner abuse, both psychologically (mental health) and physically (physical, sexual and reproductive health). These effects can impact on a woman’s ability to take part in other domains discussed in Scotland’s Gender Index, for example work.
In 2018-20, 78.6% of women experiencing partner abuse had at least one psychological effect as a result of the most recent (or only) incident of psychological or physical abuse partner abuse in the previous 12 months. This is very similar to the figure in 2016-18, which was 80.0%.
In 2018-20, 31.7% of women experienced at least one type of physical effect as a result of the most recent incident of psychological or physical partner abuse in the previous 12 months. This is an increase from 2016-18 when the percentage was 27.0%.
% of women who experienced at least one type of physical or psychological effect as a result of the most recent incident of partner abuse in the previous 12 months, 2014/15 to 2018-20
Equally Safe recognises that in some minority ethnic communities traditional gender roles can be stronger and cultural practices involving violence, such as forced marriage, more prevalent. In addition, disabled women and girls are more at risk of exploitation and coercion and may be being cared for by an abuser. Older women may be either caring for, or being cared for by, their abuser.
Equally Safe recognises that lesbian, bisexual and transgender women experience violence and abuse which targets their sexual orientation, gender identity or both; homophobia, biphobia and transphobia can drive (or be used as components of) abuse by perpetrators.
Equally Safe recognises that young women disproportionately experience intimate partner violence in relation to young men, and report much greater negative impacts as a result.
Data for this indicator comes from the Scottish Crime and Justice Survey (SCJS). Specifically it is drawn from the self-completion element of the survey. The sample size for this element was 6,549 in the combined years 2018-20.
The questionnaire is completed by respondents on the interviewer’s tablet PC (Computer Assisted Self-completion Interviewing -CASI). This ensures confidentiality when answering sensitive questions or those on illicit behaviour.
Data completed within the self-completion element of the SCJS in 2018/19 and 2019/20 has been collated to increase the sample size, and is published biennially. The 2019/20 SCJS publication contains combined 2018/19 and 2019/20 self-completion data.
In order to measure the impact of partner abuse, respondents who reported experiencing at least one incident of partner abuse in the 12 months prior to interview were asked if they had experienced a range of effects, both psychological and physical, as a result of the most recent (or only) incident of abuse.
It is worth noting that the partner abuse questions of the self-completion section of the SCJS do not ask whether offenders were in Scotland or not, therefore potentially some incidents which were perpetrated, or occurred, outwith Scotland (including online) may be included in the data. The self-completion element of the SCJS is also based on a small sample size which might affect how change over time is reflected.
SCJS is the most comprehensive survey of public experiences and perceptions of crime in Scotland. For further details see the latest Scottish Crime and Justice Survey publication.
Sexual harassment and victimisation can take place in any sphere of life: in the workplace, in the home or in wider society. The Equality Act 2010 defines sexual harassment as unwelcome sexual behaviour which compromises your dignity and makes you feel offended, humiliated, intimidated or threatened. Sexual harassment may be verbal, non-verbal or physical.
Respondents of the SCJS were asked about their experiences of stalking and harassment in the 12 months prior to interview, including victim-offender relationships and reporting to the police.
In 2018-20, 12.1% of women had experienced stalking or harassment in the past 12 months by any perpetrator, while 0.4% of women had experienced more serious sexual assault. These numbers are similar to the trend observed in 2016-18 where experience of stalking or harassment was 11.6% and experience of more serious sexual assault was 0.4%.
% of women who have experienced a more serious sexual assault or sexual harassment in the previous 12 months, 2016-18 to 2018-20
Equally Safe recognises that in some minority ethnic communities traditional gender roles can be stronger and cultural practices involving violence, such as forced marriage, more prevalent. In addition, disabled women and girls are more at risk of exploitation and coercion and may be being cared for by an abuser. Older women may be either caring for, or being cared for by, their abuser.
Equally Safe recognises that lesbian, bisexual and transgender women experience violence and abuse which targets their sexual orientation, gender identity or both; homophobia, biphobia and transphobia can drive (or be used as components of) abuse by perpetrators.
Equally Safe recognises that young women disproportionately experience intimate partner violence in relation to young men, and report much greater negative impacts as a result.
Data from SCJS demonstrates that experiences of at least one form of stalking and harassment in the last 12 months were higher among people aged 16-24 (19.0%), than any other age group. Within this age group experiences of stalking and harassment were higher among women aged 16-24 (26.9%), compared to men of the same age (12.1%).
Data for this indicator comes from the Scottish Crime and Justice Survey (SCJS). Specifically it is drawn from the self-completion element of the survey. The sample size for this element was 6549 in the combined years 2018-20.
The questionnaire is completed by respondents on the interviewer’s tablet PC (Computer Assisted Self-completion Interviewing -CASI). This ensures confidentiality when answering sensitive questions or those on illicit behaviour.
Data completed within the self-completion element of the SCJS in 2018/19 and 2019/20 has been collated to increase the sample size, and is published biennially. The 2019/20 SCJS publication contains combined 2018/19 and 2019/20 self-completion data.
It is worth noting that the partner abuse questions of the self-completion section of the SCJS do not ask whether offenders were in Scotland or not, therefore potentially some incidents which were perpetrated, or occurred, outwith Scotland (including online) may be included in the data.
SCJS is the most comprehensive survey of public experiences and perceptions of crime in Scotland. For further details see the latest Scottish Crime and Justice Survey publication.
The stalking and harassment self-completion module of the SCJS asks respondents if they have experienced one or more of the following types of incidents:
being sent unwanted letters or cards on a number of occasions
being sent unwanted emails or text messages or posts on social media sites on a number of occasions
receiving a number of unwanted phone calls
having someone waiting outside their home or workplace on more than one occasion
being followed around on more than one occasion
having intimate pictures of them shared without their consent, for example by text, on a website, or on a social media site on more than one occasion each of which can be viewed as a form of stalking and harassment.
The data does not show whether respondents themselves viewed their experiences as stalking or harassment; some respondents may also have included incidents which would not be classed as stalking and harassment, for example, potentially, receiving cold-calling sales phone calls.
More serious sexual assault is categorised in SCJS as:
forcing someone to have sexual intercourse when they did not want to
attempting to force someone to have sexual intercourse when they did not want to
forcing someone to take part in other sexual activity when they did not want to
attempting to force someone to take part in other sexual activity when they did not want to
The sub-domain of disclosure focuses on whether, and to whom, women who have experienced violence disclose their experiences. Violence against women, including forced sexual intercourse and partner abuse, continue to be underreported meaning that official figures are likely to merely be the tip of the iceberg. While the overall goal in Scottish society is to eradicate violence against women, understanding who women do (or do not) tell is vital to improving the support provided while it still continues.
The chart below shows that of women who have experienced forced sexual intercourse, almost half (49.3%) told an individual and a fifth told ‘other’ (22.3%). This demonstrates that women are are far more likely to tell an individual or other than a support service (19.9%), a health professional (17.9%), a mental health professional (12.5%) or social services (3.8%).
Importantly, 16.8% of women in 2018-20 said they had told criminal justice professionals, which is a notable increase from 1.4% in 2016-18. However, this figure is still lower than what we would like to see and reinforces the fact that judiciary/police figures relating to forced sexual intercourse are likely to significantly underestimate the rates of forced sexual intercourse in Scotland.
These results follow the pattern demonstrated in the 2020 GEI with some small differences between different categories, It must be noted that only 1.6% of women who had experienced forced sexual intercourse since the age of 16 had told none of the listed services or people, which is a significant decrease from the last Gender Index where this number was 39.9%.
% of women having experienced forced sexual intercourse in the past 12 months and have told 2016-18 to 2018-20
Equally Safe recognises that in some minority ethnic communities traditional gender roles can be stronger and cultural practices involving violence, such as forced marriage, more prevalent. In addition, disabled women and girls are more at risk of exploitation and coercion and may be being cared for by an abuser. Older women may be either caring for, or being cared for by, their abuser.
Equally Safe recognises that lesbian, bisexual and transgender women experience violence and abuse which targets their sexual orientation, gender identity or both; homophobia, biphobia and transphobia can drive (or be used as components of) abuse by perpetrators.
Equally Safe recognises that young women disproportionately experience intimate partner violence in relation to young men, and report much greater negative impacts as a result.
Data for this indicator comes from the Scottish Crime and Justice Survey (SCJS). Specifically it is drawn from the self-completion element of the survey. The sample size for this element was 6549 in the combined years 2018-20.
The questionnaire is completed by respondents on the interviewer’s tablet PC (Computer Assisted Self-completion Interviewing -CASI). This ensures confidentiality when answering sensitive questions or those on illicit behaviour.
Data completed within the self-completion element of the SCJS in 2018/19 and 2019/20 has been collated to increase the sample size, and is published biennially. The 2019/20 SCJS publication contains combined 2018/19 and 2019/20 self-completion data.
SCJS is the most comprehensive survey of public experiences and perceptions of crime in Scotland. For further details see the latest Scottish Crime and Justice Survey publication.
This indicator uses information about women who had experienced forced secual intercourse since age 16 rather than in the last 12 months prior to the survey because the sample size for the latter would be too small to allow for robust analysis. The sample for this indicator is made up of 167 women.
The groupings for this indicator are as follows:
individual: friends or relative; neighbours; someone at work
support services: Women’s Aid group; victim support services; Scottish Domestic Abuse helpline; Rape Crisis helpline
health: health professional
mental health: counsellor/therapist
criminal justice: legal professional
social services: social services
other: any other helpline; websites; someone else
Women who had experienced partner abuse in the previous 12 months were more likely to tell an individual (60.4%) than a health professional (19.1%), a support service (15.7%), a mental health professional (12.5%), social services (7.7%), or ‘other’ (8.2%).
Of women who had experienced partner abuse in the previous 12 months, 15.4% had told criminal justice professionals. This is compared to 16.8% for women who had experienced forced sexual intercourse in the previous 12 months, indicating that women who had experienced partner abuse are a little less likely than women who had experienced forced sexual intercourse to tell a criminal justice professional.
In 2018-20 just over one fifth (20.6%) of women who had experienced partner abuse in the previous 12 months had told none of the listed people or services, compared to nearly a quarter (24.5%) in 2016-18.
This also is compared to 1.6% of women who had experienced forced sexual intercourse. This indicates that respondents who had experience of partner abuse were less likely to disclose this experience altogether, compared to those who had experienced forced sexual intercourse.
% of women having experienced partner abuse in the past 12 months and have told… 2016-18 to 2018-20
Equally Safe recognises that in some minority ethnic communities traditional gender roles can be stronger and cultural practices involving violence, such as forced marriage, more prevalent. In addition, disabled women and girls are more at risk of exploitation and coercion and may be being cared for by an abuser. Older women may be either caring for, or being cared for by, their abuser.
Equally Safe recognises that lesbian, bisexual and transgender women experience violence and abuse which targets their sexual orientation, gender identity or both; homophobia, biphobia and transphobia can drive (or be used as components of) abuse by perpetrators.
Equally Safe recognises that young women disproportionately experience intimate partner violence in relation to young men, and report much greater negative impacts as a result.
Data for this indicator comes from the Scottish Crime and Justice Survey (SCJS). Specifically it is drawn from the self-completion element of the survey. The sample size for this element was 6549 in the combined years 2018-20.
The questionnaire is completed by respondents on the interviewer’s tablet PC (Computer Assisted Self-completion Interviewing -CASI). This ensures confidentiality when answering sensitive questions or those on illicit behaviour.
Data completed within the self-completion element of the SCJS in 2018/19 and 2019/20 has been collated to increase the sample size, and is published biennially. The 2019/20 SCJS publication contains combined 2018/19 and 2019/20 self-completion data.
SCJS is the most comprehensive survey of public experiences and perceptions of crime in Scotland. For further details see the latest Scottish Crime and Justice Survey publication.
The sample for this indicator is made up of 126 women who had experienced at least one type of partner abuse (psychological or physical) in the last 12 months.
The groupings for this indicator are as follows:
individual: friends; relatives; neighbours; someone at work
health: doctor; health visitor or nurse; midwife
mental Health: counsellor/therapist; mental health/addiction service
support services: Women’s Aid group; Victim Support Scotland; Scottish Domestic Abuse helpline; Rape Crisis helpline; Men’s Advice Line
social services: social services, housing department, benefit agency
criminal justice: police; legal professional
other: any other helpline; other group or organisation; someone else
Femicide refers to the intentional murder of women because they are women. Measuring the extent of femicide is inherently difficult and relies on the existence of data deriving from detailed and reliable records that identify characteristics of the victim and the perpetrator, the relationship between the two, and their environment, motivations and patterns of behaviour, among other factors.
A large proportion of femicide involves women in violent relationships, and is committed by current or former partners according to WHO. Such incidences can be captured partially through national administrative data on intentional homicide of women by an intimate partner or by family members. In this case the working group has concluded that it is appropriate to use administrative data that measures the number of women who were victims of homicides carried out by a partner/ex-partner. This is considered an adequate proxy, but it is worth noting that there is potential for this data to include cases where the motive is different (i.e. murder not specifically because of a woman’s gender) and that there is also potential for this data to exclude cases of femicide which are committed by persons other than partners and ex-partners.
When considering rates of femicide in Scotland, it is worth consulting the EIGE Gender Equality Index, which treats Scotland separately from England and Wales with regard to this indicator and ranks Scotland as having the 7th lowest rate of femicide out of the 17 EU member states considered (as of 2016).
In the years from 2009/10 to 2022/23 99 women were victims of homicides carried out by a partner/ex-partner. Numbers have been relatively stable with a high of 12 homicides in 2010/11 and a low of 3 homicides in 2020/21. In 2022/23 6 women were victims of homicides carried out by a partner/ex-partner, an increase from 9 in 2020. This is slightly lower than the mean number (7.2) for the past 14 years since the start of the time series.
Number of women who were victims of homicides carried out by a partner/ex-partner 2009/10 to 2022/23
Equally Safe recognises that in some minority ethnic communities traditional gender roles can be stronger and cultural practices involving violence, such as forced marriage, more prevalent. In addition, disabled women and girls are more at risk of exploitation and coercion and may be being cared for by an abuser. Older women may be either caring for, or being cared for by, their abuser.
Equally Safe recognises that lesbian, bisexual and transgender women experience violence and abuse which targets their sexual orientation, gender identity or both; homophobia, biphobia and transphobia can drive (or be used as components of) abuse by perpetrators.
Equally Safe recognises that young women disproportionately experience intimate partner violence in relation to young men, and report much greater negative impacts as a result.
The data for this indicator comes from the Homicide in Scotland 2022/23 statistical bulletin. These statistics are based on a snapshot of Police Scotland’s homicide database at an agreed date.
The Homicide in Scotland statistical bulletin forms part of a series of bulletins produced by the Scottish Government on the criminal justice system.
This sub-domain measures women’s perceptions of safety in their local area. It utilises data from the SCJS, where respondents were asked how safe they felt when walking alone in their local area after dark. In this sub-domain, unlike the others in this domain, the goal is to achieve gender parity between men and women; specifically, that 100% of both genders will feel completely safe in their local areas.
This sub-domain measures women’s perceptions of safety and fears about crime in their local area. It utilises data from the Scottish Crime and Justice Survey (SCJS), where respondents were asked how safe they felt when walking alone in their local area after dark.
Women have consistently felt less safe than men since 2008/09, and in 2018-20, close to two thirds (64.9%) of women stated that they felt safe walking alone in their local area after dark compared to nine tenths (90.2%) of men. Nonetheless, since 2008/09 the trend for both sexes has been to feel more safe over time - 55.0% of women and 79.0% of men felt safe walking alone in the local area after dark in 2008/09, a change of 10 and 11 percentage points respectively.
% of adults who felt safe walking alone in the local area after dark, by gender 2008/09 to 2018-20
SCJS data collected in 2019/20 found that those living in the 15% most deprived areas of Scotland, disabled adults, younger adults (aged 16-24) and older adults (aged 60+), and victims of crime were less likely to report feeling safe in 2019/20 than comparative groups, which is similar to findings from SCJS 2017/18.
Data for this indicator is drawn from the interviewer-led section of the Scottish Crime and Justice Survey (SCJS), as opposed to the self-completion section. This element was completed using Computer-Assisted Personal Interviewing (CAPI). Rather than combining the 2018/19 and 2019/20 SCJS data this indicator focuses solely on the 2019/20 SCJS data. The sample size for the 2019/20 survey was 5,568.
In 2017, the Scottish Government carried out an initial exploratory piece of work with a view to developing a new Gender Equality Index, and produced a working paper which describes the process that it followed at that time. This considered whether or not Scotland should replicate an already internationally-established Index, produced by the European Institute for Gender Equality (EIGE). However, this exploratory work found that data limitations made full replication of this index unworkable.
A process of consultation with external stakeholders was conducted, and a Scottish Government-led working group with prominent women’s organisations and academics was set up to advise on the development of a Gender Equality Index (GEI). The working group comprised of Scottish Government analysts with expertise on the available data sources, and stakeholders providing expertise on gender inequality across each of the domains.
To best meet user needs, we decided to build a new bespoke index that uses some of the features of the EIGE index, but with a more Scotland appropriate selection of indicators. This new Index would be designed to set a baseline and monitor change at Scotland level through time.
We recognise the importance of listening to feedback on Scotland’s Gender Equality Index. There may be some scope for the indicator set to evolve but it should be noted that any change to the indicator set will likely affect the primary purpose to track progress towards gender equality over time. There have been some changes to indicators in the current edition of the GEI but we have attempted to keep these changes minimal so they do not substantially affect the comparability with the 2020 iteration.
It was considered whether or not it would be possible to use the new index to compare Scotland to other countries across Europe. However, the existing data available for Scotland would have limited the comparability with European data sources. Instead, we have developed a Scotland-specific set of indicators that better reflect the Scottish context, and will allow gender equality in Scotland to be monitored over time.
The intended audience for this Index is broad and includes the public, the media and policy makers who aren’t data experts but have an interest or a role in advancing gender equality. The Scottish Government publishes sex and gender-disaggregated breakdowns in many of its statistical publications and tools such as the Equality Evidence Finder help users to locate these. However, it can be difficult for policy makers to easily access an up-to-date picture which encompasses the many facets of gender equality. It is hoped that this new Scottish Gender Equality Index will help fill this gap.
It is expected that Scotland’s index will be updated in full every three years. Although some of the data are routinely collected and updated annually e.g. much of the work domain, other parts of the index require specially commissioned work. Time use data is expensive to collect and hence is only gathered periodically by the ONS - to gain robust data for Scotland, an additional sample boost has to be commissioned. Some of the ‘money’ indicators were collected through a bespoke Scottish Social Attitudes survey module, and the ‘power’ domain predominantly relies on research which would require recommissioning for each update. In other areas, e.g. the gender pay gap, annual variability means that it is often more prudent to look back longer than a year to get a sense of the overall trend.
Composite Indexes and Measurement frameworks have value because they bring together a range of indicators, and by comparing them across places and over time this will help a wider audience to judge whether progress is being made and where key challenges remain. This new Gender Equality Index will also hopefully help this audience to understand that in order to successfully tackle gendered issues, such as the gender pay gap, action needs to be taken in many different domains and at different stages of women and men’s lifetimes. It was decided by experts at an initial workshop that an ‘Index’ would be preferable to a ‘Measurement Framework’ due to greater simplicity of its messaging and presentation. However, it was noted that care would have to be taken to ensure that users do not make direct comparisons between the Scottish Index and the EIGE Index. It was also agreed that the Scottish Government should host the final publication.
From the beginning, it was envisaged that this first attempt will be primarily a learning experience and that it was likely that we would need to work on this for a number of years before we had a robust complete index for Scotland.
Whilst we have used a different basket of indicators, the index is structured and derived in a similar way to the EIGE index.
The index comprises of six core domains. Each domain in turn comprises of two or three sub-domains. Finally, each subdomain contains 2-4 indicators.
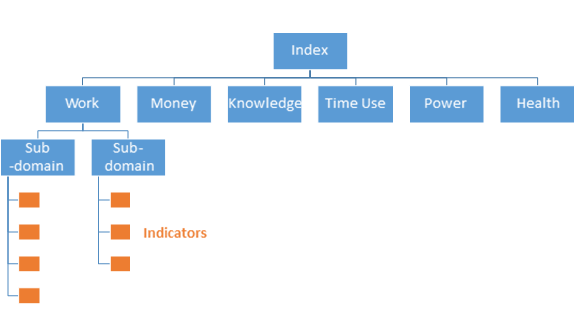
Each indicator is given a gender equality score of between one (complete inequality between women and men) and 100 (complete equality). These indicators are aggregated into a sub-domain gender equality score, which are in turn aggregated into domain and overall index equality scores.
There are also a number of additional indicators in “satellite” domains not included in the main index, where comparing women and men isn’t meaningful (women-specific healthcare), or where the goal is eradication rather than equal rates for women and men (violence against women).
The steps involved in calculating the index are: -
Indicators were selected based on the criteria:
A similar number of indicators have been included within each domain. This publication is using source data published between 2019 and 2023. The most recent data for the majority of the indicators is 2022, however, some indicators in Time and Violence Against Women and Girls has sources which were updated earlier in 2023, hence the source year is 2023. The indicator scores calculated from this data are considered to be ‘2023’ gender index scores. The indicators use ‘official statistics’ unless otherwise specified in the methodology. For some indicators, newer data is available and can be found on the Equality Evidence Finder and in the source publications.
Indicator data is transformed so that it is on a consistent scale, allowing different gender equality scores to be compared.
The calculation used by EIGE involves: -
\[1+99\left(1- \left| \frac{women}{\frac{1}{2}(women+men)} - 1\right|\right)\]
Gender equality scores measure the relative gap between women and men, with higher scores given where the relative difference is small compared to the overall value. A percentage point difference between women and men will give a different score depending on the mid-point value. This means that indicators will give different equality scores, depending on the direction of the scale.
For consistency, all indicators scores are calculated based on the high values representing the desirable outcome. For some indicators such as underemployment, this requires reversing the direction of the scale (i.e. using “% of adults not underemployed”) as not being underemployed is the desirable outcome of the indicator.
Please note that high scores do not always translate to good outcomes as in some domains, such as Health, equally poor outcomes for men and women can result in a high gender equality score. Moreover, a change of the equality score can occur with changes in the underlying data, such as when changes occur in the underlying data for one group but not for the other. For example, in 2023 there has been a large drop in men’s pension wealth while numbers for women have increased very slightly, bringing pension wealth figures for both groups more in-line with each other. The indicator and sub-domain scores have therefore increased, making it seem like an improvement to wealth equality, however this is driven by a drop in pension wealth for men.
The proportion of women with two or more risk behaviours in 2019 was 27 and the proportion of men was 29.
For this indicator, the more healthy option corresponds to lower percentages. So we first reverse the direction of the scale to give the proportion of adults with one or fewer health risk behaviours (women: 73; men: 71).
We then compare the women’s value (73) to the mid-point between the women’s and men’s value \(\frac{1}{2}(73+71)=72\) to give a gender equality score of \[1+99\left(1- \left| \frac{73}{72} - 1\right|\right) = 1+99\left(1-0.01\right)=99\]
The approach used for aggregating indicators is similar to that of the EIGE index. Arithmetic and geometric means are different methods for calculating averages. The arithmetic mean is the standard way to calculate an average, and was used when aggregating indicators into sub-domains. The geometric mean is an alternative method in which high scores balance out low scores to a lesser extent than with the arithmetic mean. This means that a low sub-domain score will bring down the domain score by a greater amount.
An analytic hierarchy process approach was used to derive domain weightings, with members of the working group informing the final weightings to reflect the priorities in Scotland. Members of the working group were asked to rate the relative importance of the 15 pairs of domains (e.g. is work more/less important than money?; work vs time).
The domain weights used are:
| Domain | Weight |
|---|---|
| Time Use | 27 |
| Work | 21 |
| Power | 19 |
| Money | 18 |
| Knowledge | 8 |
| Health | 7 |
The Scottish Government acknowledges and thanks the expert working group who advised it on the development of the index over a two year period. The group was comprised of colleagues from the following organisations:
Close the Gap
EHRC Scotland
Engender
Equate
WiSE
Women’s Enterprise Scotland
These colleagues provided a great deal of experience and a breadth of expertise and we are very grateful for their contribution. We do however recognise that this is not a complete and exhaustive list of women’s organisations across Scotland.
We would also like to thank all the Scottish Government lead analysts who contributed to the project.
This report was produced by the Equality Analysis team at the Scottish Government.
Official and National Statistics are produced to high professional standards set out in the Code of Practice for Official Statistics. Both undergo regular quality assurance reviews to ensure that they meet customer needs and are produced free from any political interference.
For enquiries or feedback about this publication please contact:
Communities Analysis Division
Telephone: 0131 244 5851
e-mail: social-justice-analysis@gov.scot
For general enquiries about Scottish Government statistics please contact:
Office of the Chief Statistician
Telephone: 0131 244 0442
e-mail: statistics.enquiries@gov.scot
The data collected for this statistical bulletin may be made available on request, subject to consideration of legal and ethical factors. Please contact social-justice-analysis@gov.scot for further information.
If you are not satisfied with our service or have any comments or suggestions, please write to the Chief Statistician:
3WR St Andrews House
Edinburgh, EH1 3DG
Telephone: (0131) 244 0302
e-mail statistics.enquiries@gov.scot
If you would like to be consulted about statistical collections or receive notification of publications, please register your interest at www.gov.scot/scotstat
Details of forthcoming publications can be found at www2.gov.scot/Topics/Statistics/ForthcomingPubs
You may use or re-use this information (not including logos) free of charge in any format or medium, under the terms of the Open Government Licence. See: www.nationalarchives.gov.uk/doc/open-government-licence/
Social/Leisure Activities
Social and leisure activities are important for maintaining physical and mental health. Participation in outdoor and physical activities predicts physical health, while home-centred and social activity participation can be good for mental health.
The indicator of social/leisure activities is made up of leisure activities which have a social element. Examples include: spending time with friends, family, neighbours and colleagues; telephoning, texting, emailing or writing letters to friends and family; playing team sports, and playing other sports and exercising, including hiking. This activity category also includes cultural activities: such as visits to the cinema, theatre, concerts, sporting events, museums, galleries and the library, and health and wellbeing activities including meditating, having a massage and spa or wellbeing treatments.
It’s worth noting when considering the 2020 data that as a result of the COVID-19 lockdowns and subsequent restrictions a number of these activities were not possible, particularly face-to-face socialising with members outside of a person’s household (during lockdown) and cultural activities, such as attending the theatre, concerts and sporting events. It is the case that in 2023 both men and women - but particularly men - spent more time on social/leisure activities than was the case in 2020. While it is not possible to establish causation, it is likely that this was related to the COVID-19 lockdowns and subsequent restrictions. Future data will help to establish if the 2023 data is more in line with standard patterns of time use.
In 2020, women spent more time on social/leisure activities than men - an average of 94 minutes per day, compared to 73 minutes for men. This pattern was similar in 2020, however, both women and men spent less time on these activities then with 86 minutes on average for women and 51 minutes for men.
In 2023, Scotland’s score on this indicator is 88, an increase on 2020 when the score was 75.
It should be noted that difference here is caused by the fact that women spent more time on social/leisure activities than men. However, it is not the case that men have less free time than women overall, but rather that they spent more time on ‘other activities’. These are activities which have less of a social element, such as watching TV or browsing the internet. See 2023 Time Use Survey for more details.
Chart
Average minutes per day spent on leisure/social activities as a main activity, by gender 2020 to 2023
Source: Time Use in Scotland 2023
Intersectionality
Information on how gender intersected with other population characteristics in the 2020 or 2023 OTUS is not currently available. Detailed analysis on how different equality groups in Scotland spent their time in 2020 is available in the 2020 Time Use Survey.
Methodology
This indicator measures the average minutes per day spent on leisure/social activities as a main activity. The reference population was all adults (18+). The gender equality score was calculated by comparing the value for women with the mid-point of men and women. See the Methodology chapter for further details.
Fieldwork for the OTUS 2023 was carried out between 11 and 19 March 2023. The survey used a representative sample of UK participants selected from the National Centre for Social Research NatCen Panel using a probability-based sampling approach. The Scottish component of the OTUS 2023 drew on the ScotCen Panel (NatCen in the rest of the UK) for responses. This panel is made up of 4,000 people aged 16 and over living in England, Scotland and Wales who were invited to take part after completing the British or Scottish Social Attitudes surveys. The Scottish sample was made up of 453 females (842 diary days) and 399 males (737 diary days). Data was weighted to be representative of the Scottish population, taking into account age, ethnicity, sex, employment. Weighting also factored in differences between weekdays and weekends.
The 2023 OTUS gathered information using pre-coded time use diaries - participants recorded their activities at 10 minute intervals in time use diaries provided by the researchers. They were asked to provide completed diaries on two randomly allocated days which included, by design, one weekday and one weekend day. Diary entries were then recorded by the participants online where possible, or were contacted over the phone by interviewers who recorded diary information on participants’ behalf.
Time is reported in average minutes per day. For the indicator of developmental childcare this average is calculated using only those members of the sample who have children in their household.
It should be noted that this indicator is based on ‘Official Statistics in Development’.