Poverty and Income Inequality in Scotland 2017-20
A Scottish Government National Statistics publication
Published on 25 March 2021
This report presents three-year averaged estimates of the proportion of people, children, working-age adults and pensioners in Scotland living in poverty, and other statistics on household income and income inequality. These estimates are used to monitor progress in reducing poverty, child poverty and income inequality.
The latest estimates are from the period between April 2017 and March 2020. This was before the first UK-wide lockdown due to the coronavirus (COVID-19) pandemic. Therefore, these statistics do not yet tell us anything about the impact of the pandemic on poverty and income inequality.
Revision on 14 June 2021:
- Figures 15-17 now include the previously missing '3 or more children' category.
- Reference tables now include the previously missing table 24 'Relative child poverty by number of children in the household'.
Revision on 22 October 2021:
- We have corrected an incorrect reference period in the subtitle for Table 41 in the reference tables.
Key trends
- Relative poverty appears now stable after a recent small rise. Previously, it had been falling slowly since the nineties.
- Income inequality continues to fluctuate.
- Median household incomes continue to rise.
19% of people were living in relative poverty after housing costs in 2017-20. Overall, the poverty rate appears to have stopped rising.
The top 10% of the population had 21% more income in 2017-20 than the bottom 40% combined.
Median income before housing costs in Scotland in 2017-20 was £533 a week, continuing the rising trend.
Longer-term trends of poverty and income inequality in the UK, which are similar to those in Scotland, are available from the Department for Work and Pensions’ Households Below Average Income publication on page 12 of the main report.
What you need to know
Statistics in this report are based on data from the Family Resources Survey. This survey has been the main source of information on household income and poverty in Scotland since 1994/95.
Income and poverty measures
The Scottish Government measures different aspects of poverty with different indicators. The most commonly used poverty indicator in Scotland for showing trends is relative poverty after housing costs. Other poverty measures in this report are absolute poverty, material deprivation, and degrees of household food security. These are included in additional charts throughout the report.
Unless otherwise stated, these statistics are based on net income and adjusted for household size. Net income is income from earnings, social security payments and other sources minus taxes. All incomes are in 2019/20 prices (real prices). Estimates in this publication are rounded to the nearest £1 for weekly incomes, £100 for annual incomes, 1% for proportions and ratios, and 10,000 for populations. Poverty is defined at the household level. If the household income is below the poverty threshold, all people within the household are in poverty.
Survey data
The estimates in this publication are based on a sample survey and are therefore subject to sampling variation.
For example, the child poverty rates for Scotland can vary within a typical uncertainty range of plus or minus three percentage points, or plus or minus 40,000 children. This means that the proportion of children in relative poverty is likely to be somewhere between 21% and 28%. And the number of children in relative povery after housing costs is likely to be somewhere between 200,000 and 280,000 children. Poverty rates and numbers shown in this report give the central estimates only.
None of the latest changes in the estimated poverty rates in the Poverty and Child poverty sections of this report are statistically significant. It is therefore better to look at longer-term trends to confirm that a change over time is real, or that differences between groups are consistent.
Three-year averages
The poverty and income estimates are shown as three-year rolling (overlapping) averages, unless stated otherwise. Taking the average over three years reduces fluctuation due to sampling variation and shows trends and differences between groups more clearly.
Single-year estimates are also available in the associated tables.
Poverty
All individuals
The most commonly used poverty indicator in Scotland is relative poverty after housing costs. Alongside this key indicator, we also included other poverty measures, which are shown in the additional tabs below.
Relative poverty
It is estimated that 19% of Scotland’s population (1.03 million people each year) were living in relative poverty after housing costs in 2017-20. Before housing costs, 17% of the population (910,000 people) were living in poverty.
Relative poverty is a measure of whether the lowest-income households are keeping pace with middle income households across the UK.
The proportion of people in relative poverty after housing costs had been falling slightly between the late nineties and the lowest point in this time series in 2009-12. After that, it started to rise again up until now, where the rise appears to have stopped. Before housing costs poverty looks similar, with the all-time low slightly later, in 2011-14.
Absolute poverty
It is estimated that 17% of the population (900,000 people each year) were living in absolute poverty after housing costs in 2017-20. After a long decline since the beginning of this time series in the mid-nineties, absolute poverty rates have stagnated in the last decade.
Before housing costs, 14% of the population (770,000 people each year) were in absolute poverty. The trend is similar to the after housing costs measure, although the downward trend started to stagnate a few years later.
The gap between the before and after housing costs measure had widened in 2008-11, but has remained steady since.
Absolute poverty is a measure of whether the incomes of the poorest households are keeping pace with inflation, and is based on a fixed poverty threshold, the inflation-adjusted relative poverty threshold in 2010/11.
Food security
Food security is measured at a household level. The person in the household who knows most about buying and preparing food responds to the questions about food security. Note that not everyone in the household may experience this in the same way. For example, a parent may have worried about running out of food or reduced their own meal sizes, but protected their young children from this experience.
In 2019/20, 84% of the population lived in households with high food security. This means that 16% of people lived in households with marginal, low or very low food security.
People in poverty were less likely to experience high food security: just 60% of those in relative poverty, and 59% of those in absolute poverty lived in high food security households.
Household food security questions were newly added to the Family Resources Survey in 2019/20. They ask about whether people were worried about running out of food, had to reduce meal sizes or skip meals. More information can be found in the Definitions section.
Working-age adults
Working-age adults are defined as all adults up to the state pension age. Women’s state pension age reached 65 in November 2018, aligning it with men’s state pension age. Since December 2018, the state pension age for both men and women has started to increase to reach 67 between 2026 and 2028.
Relative poverty
Relative poverty for working-age adults has been broadly stable since the nineties, when reporting began. The relative poverty rate in 2017-20 was estimated to be 19% after housing costs, and 16% before housing costs.
In 2017-20, there were 650,000 working-age adults in poverty after housing costs, and 530,000 before housing costs.
Having paid work is an effective way out of poverty, and those families where all adults are in full-time work have a low poverty risk. But having a job is not always enough, for example when it does not pay well, or when someone is unable to work enough hours.
In 2017-20, 61% of working-age adults (400,000 working-age adults each year) in relative poverty after housing costs were living in a household where someone was in paid work.
The share of working-age adults in poverty who lived in working households continuously increased since 2011-14, reflecting high employment rates, and now appears largely stable.
The terms ‘working’ and ‘in-work poverty’ here refer to paid employment. They do not include unpaid work such as caring for your children or other family members. In-work poverty refers to the share of children in poverty who live in households where at least one member of the household is in either full or part-time paid work.
Before-housing-costs data looks similar, and the analysis is available in the associated tables.
Absolute poverty
Absolute poverty amongst working-age adults remained broadly stable during the last fifteen years. In 2017-20, 17% of working-age adults were in absolute poverty after housing costs, and 14% before housing costs.
This means that in 2017-20, there were 570,000 working-age adults each year in absolute poverty after housing costs, compared to 460,000 before housing costs.
Pensioners
Pensioners are adults who have reached their state pension age.
Relative poverty
The relative poverty rate after housing costs for pensioners was 14% in 2017-20, or 150,000 pensioners each year. The poverty rate has been consistently below that for working-age adults (19%) and children (24%).
Before housing costs, 17% of pensioners (170,000 pensioners) were in relative poverty.
Relative pensioner poverty after housing costs showed a long decline until 2011-14, was then largely stable for a few years before it started to rise again. In recent years, relative pensioner poverty is largely stable.
The majority of pensioners own their home. It is therefore more meaningful to use the after-housing-costs poverty measure for comparing the standard of living between pensioners and other age groups.
Absolute poverty
Absolute poverty after housing costs for pensioners was 12% (120,000 pensioners each year) in 2017-20. Before housing costs, it was 14% (140,000 pensioners).
Absolute poverty has remained broadly stable since 2008-11 following a continuous decrease since the nineties, when reporting began.
Material deprivation
In 2017-20, 5% of pensioners (50,000 pensioners each year) were in material deprivation.
Pensioner material deprivation is different to other measures of poverty, including the child low income and material deprivation measure. It does not only consider low income. It also captures other barriers to accessing goods and services, such as poor health, disability and social isolation.
More information about pensioner material deprivation can be found in the Definitions section.
Pensioner material deprivation is included for all pensioners aged 65 or over. There were some pensioners in the analysis who were younger than 65; these were not included. Therefore, this measure looks at a slightly smaller group of people than the other measures in the Pensioners section.
This data has been collected since 2009.
Child poverty
Children are more likely to be in poverty across all measures compared to adults.
The Child Poverty (Scotland) Act 2017 requires us to report every year on four different child poverty measures. The latest single-year estimates can be found in the Child poverty summary. In this report, however, we show three-year averaged estimates only, which are better for seeing trends.
In this publication, 'child' refers to a dependent child. This is explained in the Definitions section.
Trends
Relative poverty
It is estimated that 24% of children (240,000 children each year) were living in relative poverty after housing costs in 2017-20. Before housing costs, it is estimated that 21% of children (210,000 children each year) were in relative poverty.
After a long fall between the late nineties and 2010-13, which slowed briefly just before the recession, child poverty rates have been gradually rising again.
Having paid work is an effective way out of poverty, and those families where all adults are in full-time work have a low poverty risk. But having a job is not always enough, for example when it does not pay well, or when someone is unable to work enough hours.
While the poverty risk is much lower for children in working households compared to those in non-working households, not all work pays enough to lift the household above the poverty threshold.
It is estimated that in 2017-20, 68% of children in relative poverty after housing costs were living in working households (160,000 children each year).
This data suggests that after a steady and steep increase of in-work poverty since 2007-10, reflecting high employment rates, in-work poverty is now stable at a high level.
The terms ‘working’ and ‘in-work poverty’ here refer to paid employment. They do not include unpaid work such as caring for your children or other family members. In-work poverty refers to the share of children in poverty who live in households where at least one member of the household is in either full or part-time paid work.
Before-housing-costs data looks similar, and the analysis is available in the associated tables.
Absolute poverty
Absolute child poverty after housing costs affected 22% (210,000 children each year). Before housing costs, absolute child poverty was at 17% (170,000 children each year).
Absolute child poverty before housing costs steadily decreased between the mid-nineties and just before the recession. The decrease of the after-housing-costs rate then slowed down. The before-housing-costs measure continued to decrease until 2013-16 and has been largely flat since.
Material deprivation
It is estimated that 13% of children (120,000 children each year) were living in combined low income and material deprivation after housing costs in 2017-20. Before housing costs, this was 11% of children (110,000 children).
Combined low income and child material deprivation is an additional way of measuring living standards. It is about households who cannot afford basic goods and activities that are seen as necessities in society.
More detail on this can be found in the Definitions section.
Material deprivation data has been collected since 2004/05. Due to a change in the methodology, it is not possible to compare the most recent years with years before 2010-13. This is shown as a break in the chart.
Food security
Food security is measured at a household level. The person in the household who knows most about buying and preparing food responds to the questions about food security. Note that not everyone in the household may experience this in the same way. For example, a parent may have worried about running out of food or reduced their own meal sizes, but protected their young children from this experience.
In 2019/20, 75% of children lived in households with high food security. This means that 25% of children lived in households with marginal, low or very low food security.
Children in poverty were less likely to have high food security: just 48% of those in relative poverty, and 49% of those in absolute poverty lived in high food security households.
Household food security questions were newly added to the Family Resources Survey in 2019/20. They ask about whether people were worried about running out of food, had to reduce meal sizes or skip meals. More information can be found in the Definitions section.
Priority groups
Some types of households with children are known to be at a particularly high risk of poverty. These include households with single parents, three or more children, disabled household members, of a minority ethnic background, with a child aged under one, or a mother aged under 25. These groups do not cover everyone at higher risk of poverty, but taken together, they cover the majority of households with children that are in poverty.
Note that households with mothers aged under 25 are not included in this analysis, because there were too few in the sample to provide robust estimates.
Here, the minority ethnic group includes white minorities such as white people who are not British. The Equality analysis section includes more detailed ethnicity categories.
Relative poverty
Children in the priority groups were more likely to be in relative poverty compared to all children. This was in particular true for those in ethnic minority households, and those with a single parent in the household.
Absolute poverty
Children in the priority groups were more likely to be in absolute poverty compared to all children. This was in particular true for those with a single parent in the household and for ethnic minority households.
Material deprivation
Children in the priority groups tended to be more likely to be in combined low income and material deprivation compared to all children, except for those with a child under 1. This was in particular true for those with a single parent in the household.
Equality analysis
Age
Poverty is measured at a household level. Everyone in the same household is considered either in poverty or not in poverty. This makes it difficult to measure the poverty rate by age or gender of an individual person if they share the households with others.
The age analysis includes adults in both, single- and multi-person households. But the trend shown in Figure 18, that the youngest adults have the highest poverty rates, holds true for single-adult households as well.
In the last 15 years, the youngest adults (16-24 year olds) have been consistently more likely to be in relative poverty compared to older adults.
In 2017-20, 28% of adults aged 16-24 were in relative poverty after housing costs (140,000 adults each year), compared to 15% of adults aged 65 and older (150,000 adults). The age groups in between all had similar poverty rates between 17% and 19%.
Figure 19 shows the latest estimates for adults, and also includes children. It shows that not only do the youngest adults have the highest poverty rates, but also the youngest children.
In 2017-20, 28% of children aged four and under were in relative poverty after housing costs (80,000 children each year). This compares to 22% (100,000 children) of the five to twelve year-olds, and 25% (60,000) of teenagers.
Some 16 to 19 year-olds are considered dependent children, and others are considered adults. The '13-19' category includes 16 to 19 year-old dependent children. The '16-24' category includes 16 to 19 year-old adults. The term 'dependent child' is explained in the Definitions section.
Gender
Poverty is measured at a household level. This means that men and women in the same household are both either in poverty or not in poverty. In the analysis below, we therefore only include single adult households (with or without dependent children).
In 2017-20, the relative poverty rate after housing costs for all single adults (working-age and pensioners) was 27%, higher than for the total population (19%).
Single working-age adults and gender
The poverty rate was highest for single women with children (38%, 40,000 single mothers each year). The poverty rate for single women without children was 27% (60,000 women), and for single men without children was 34% (90,000 men). Estimates for single fathers are not available due to small sample sizes.
Until 2010-13, the gap in poverty rates between these groups had narrowed, but in recent years it widened again.
In this publication, 'child' refers to a dependent child living in the household. This is explained in the Definitions section.
Single pensioners and gender
In 2017-20, 20% of single female pensioners (50,000 women each year) and 17% of single male pensioners were in relative poverty after housing costs. Note that there were too few single male pensioners in poverty in the sample to produce a robust estimate of their population.
In most years, the poverty rate after housing costs for single female pensioners had been higher than that for single male pensioners, with this gap only recently widening and closing again.
Some of the difference in pensioner poverty between genders may be due to different age profiles. For example, in 2017-20, 40% of female single pensioners were aged 80 or older compared with 30% of male single pensioners. Older pensioners may have different sources of income which may result in them having lower incomes.
Marital status
In 2017-20, the relative poverty rate after housing costs was highest for single adults (27%, 260,000 adults each year) and divorced (or separated) adults (27%, 100,000). Married adults were the least likely to be in poverty (13%, 260,000), and widowed and cohabiting adults were in the middle (19% and 19%; 60,000 and 120,000).
Poverty among widowed and divorced/separated adults largely decreased over the long term, whereas the trend for singles, cohabiting and married adults was broadly flat over time.
By 'Single' we mean adults who have never been married or in a Civil Partnership, and are not living with their partner. The 'Married' category includes Civil Partnerships, and couples who are married or in a Civil Partnership but temporarily living apart. The 'Divorced' category includes divorced couples, dissolved Civil Partnerships, and couples who are married or in a Civil partnership but are not living together because of estrangement.
Ethnicity
Ethnicity data relates to all people in a household and is based on the ethnicity of the adult with the highest income.
In 2015-20, people from non-white minority ethnic groups were more likely to be in relative poverty after housing costs compared to those from the ‘White - British’ and ‘White - Other’ groups.
The poverty rate was 41% for the ‘Asian or Asian British’ ethnic groups (50,000 people each year), and 43% for ‘Mixed, Black or Black British and Other’ ethnic groups (no population estimate available due to the small sample).
The poverty rate amongst the ‘White - Other’ group was 24% (80,000 people) and that of the ‘White - British’ group was 18% (860,000 people).
This analysis doesn't take into account differences in the age profiles of the ethnic groups.
For the 'White - British' ethnic group the median average age of the highest income earner was 50, compared with a median age of 34 for the 'White - Other' ethnic group, 34 for 'Asian or Asian British' and 36 for 'Mixed, Black, Black British or Other' ethnic groups.
Older people have a lower poverty rate, so the age profile partly explains the lower poverty rate for the 'White - British' ethnic group. However, the age difference cannot explain the entire gap in poverty rates between ethnic groups.
More information on ethnicity data
Figure 23 shows an ethnicity breakdown based on an average of data from the past five years. This provides a reasonably detailed breakdown, whilst still using relatively recent data. A more detailed ethnicity breakdown using ten years of data was previously published.
Due to the small sample sizes for some of the ethnic groups, and the fact that ethnic composition of the population is not accounted for in the survey weighting process, estimates fluctuate between years and the measurement uncertainty will be fairly large. A time series has not been produced for poverty rates by ethnicity, as this uncertainty in the data will obscure any long-term trends. Similarly, the estimated number of people in poverty is not available for some ethnic groups due to small sample sizes.
Religion
Data on religion is available for adults only, so this analysis does not include children.
In 2015-20, Muslim adults were more likely to be in relative poverty (52%, 30,000 each year) than adults overall (18%), after housing costs were taken into account.
Of adults belonging to the Church of Scotland, 15% were in relative poverty after housing costs (170,000 adults each year), compared to 19% of Roman Catholic adults (110,000 adults) and adults of other Christian denominations (19%; 70,000 adults).
This analysis doesn't take into account differences in the age profiles of the religions.
For adults belonging to the Church of Scotland, the median average age was 62. In contrast, the median age was 36 for Muslim adults, and 41 for adults belonging to no religion.
Older adults have a lower poverty rate, so age profile partly explains the lower poverty rate for adults belonging to the Church of Scotland. However, the age difference cannot explain the entire gap in poverty rates between religious groups.
More information on religion data
Figure 24 shows an average for data from the past five financial years.
Due to the small sample sizes for some of the religious groups, and the fact that religious composition of the population is not accounted for in the survey weighting process, estimates fluctuate between years and the measurement uncertainty will be fairly large. A time series has not been produced for poverty rates by religion, as this uncertainty in the data will obscure any long-term trends. Similarly, the estimated number of adults in poverty is not available for some religious groups due to small sample sizes.
Disability
Poverty rates remain higher for households in which somebody is disabled compared to those where no-one is disabled. The gap between the two groups has remained fairly steady over the last few years.
In 2017-20, the poverty rate after housing costs for people in households with a disabled person was 23% (500,000 people each year). This compares with 17% (540,000 people) in a household without disabled household members.
The way in which information on disabled people is collected changed several times during this timeseries. This causes breaks in the timeseries.
Since 2012/13, disabled people are identified as those who report any physical or mental health condition(s) or illness(es) that last or are expected to last 12 months or more, and which limit their ability to carry out day-to-day activities. Due to these changes, care needs to be taken when considering long-term trends.
More detail can be found on pages 34-36 in the 2015/16 Households Below Average Incomes technical report.
Additional living costs of disabled people
Some illnesses and disabilities incur additional living costs. The poverty measure does not normally consider this. However, the analysis shown in Figure 26 uses an adjusted poverty rate that partly accounts for additional living costs for those households where someone receives disability benefits.
Research shows that additional costs associated with disability vary greatly in level and nature. There is no general agreement on how to measure these costs.
The analysis in Figure 26 excludes Disability Living Allowance, Attendance Allowance and Personal Independence Payments from total household income. These benefits are paid as a contribution towards the additional living costs for disabled people. If this income is excluded from total household income, then we are able to compare households with and without a disabled household member on a more like for like basis.
In 2017-20, as in previous years, the poverty rate was higher for individuals in households with a disabled person, when disability-related benefits are not included in the household income. After housing costs, the poverty rate was 29% (640,000 people each year) for people living with a disabled household member, and 16% (500,000 people) for those without.
Excluding disability benefits from the analysis changes the poverty threshold. This is because some households now have a lower income, which lowers the median and therefore also the poverty threshold. As a consequence, some households without a disabled person that were just below the poverty threshold in the previous analysis will now be above the threshold. As a result, the poverty rate for households without a disabled person is slightly lower.
Income inequality
Palma
The Palma ratio of income inequality is the total income of the top ten percent of the population divided by the total income of the bottom forty percent of the population (written as a percentage). It is commonly used to estimate how much more income top-income households have compared to those at the bottom.
The Palma ratio is usually calculated from income before housing costs, but we have included it for after-housing-costs income as well. After-housing-costs incomes are distributed more unequally.
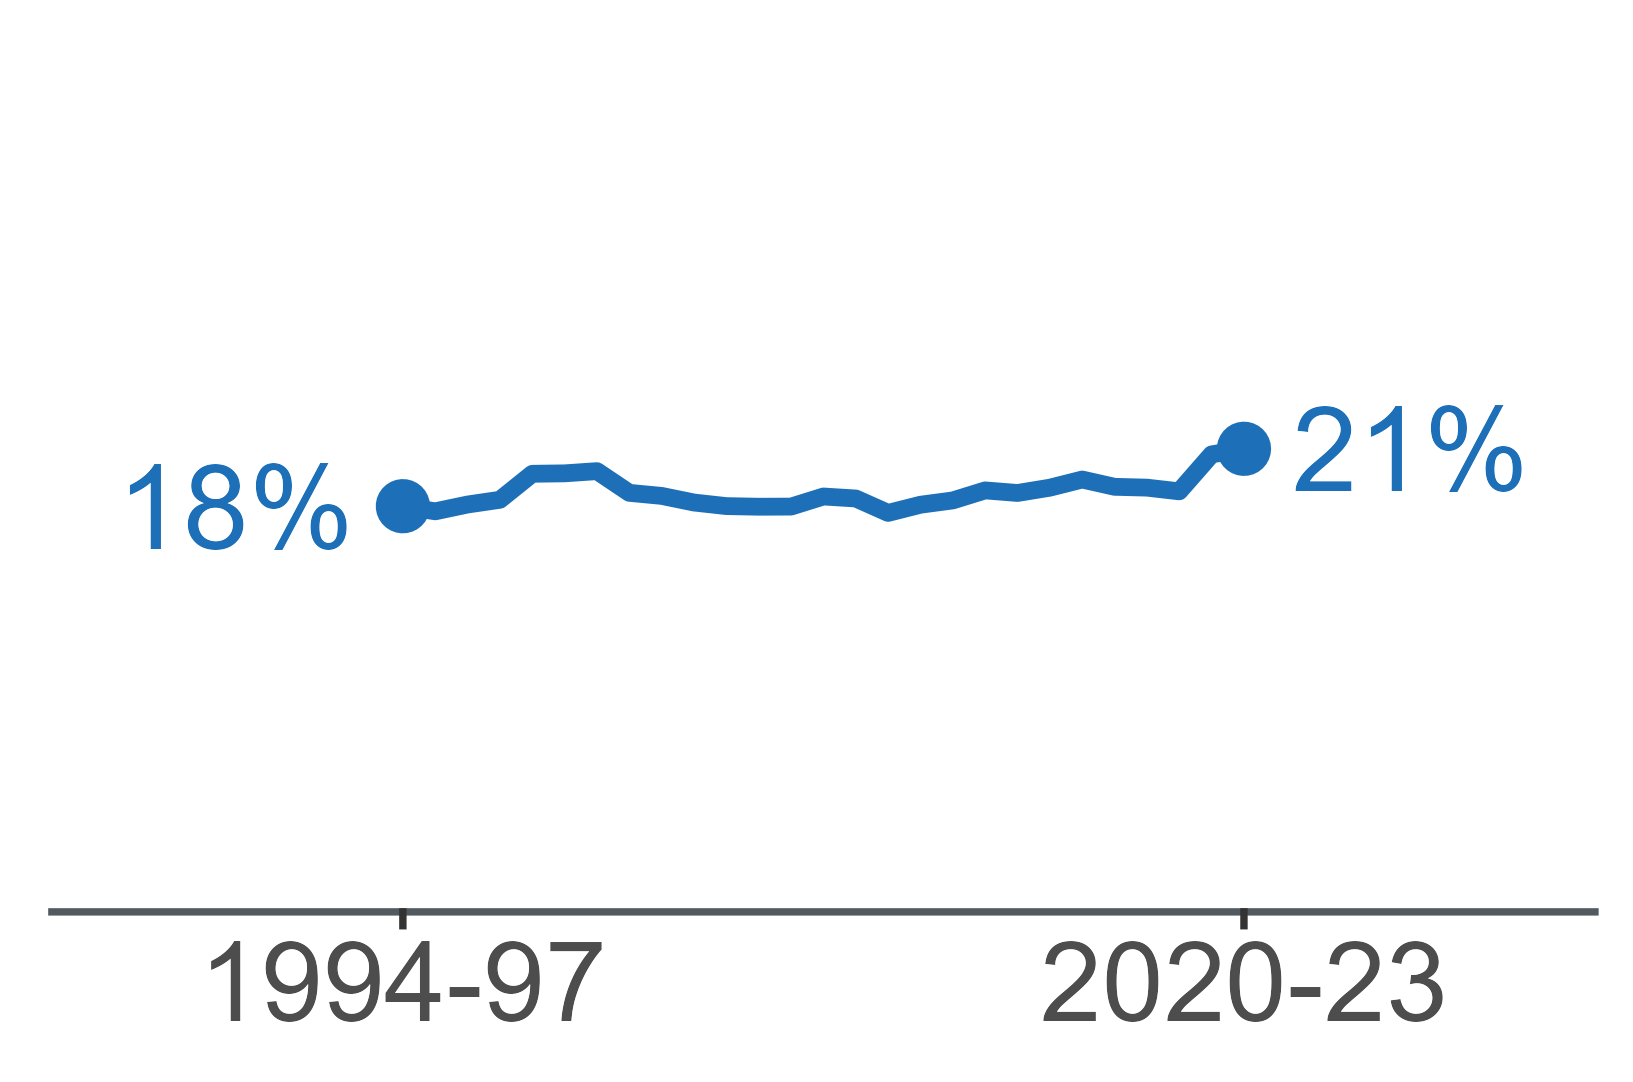
In 2017-20, the top ten percent of the population had 21% more income (before housing costs) than the bottom forty percent combined. This compares to 33% more income of the top ten percent in 2007-10, the period with the highest income inequality in this time series as measured by the Palma ratio.
Income inequality has been fluctuating since the beginning of this data collection in the mid-nineties, and, after the most recent high point in 2015-18 is currently decreasing again.
Income decile shares are also available in the associated tables.
Gini
The Gini coefficient measures income inequality on a scale from 0% to 100%. A Gini of 100% means that only one person has an income, and everyone else has none. A Gini of 0% means that everyone has the same income.
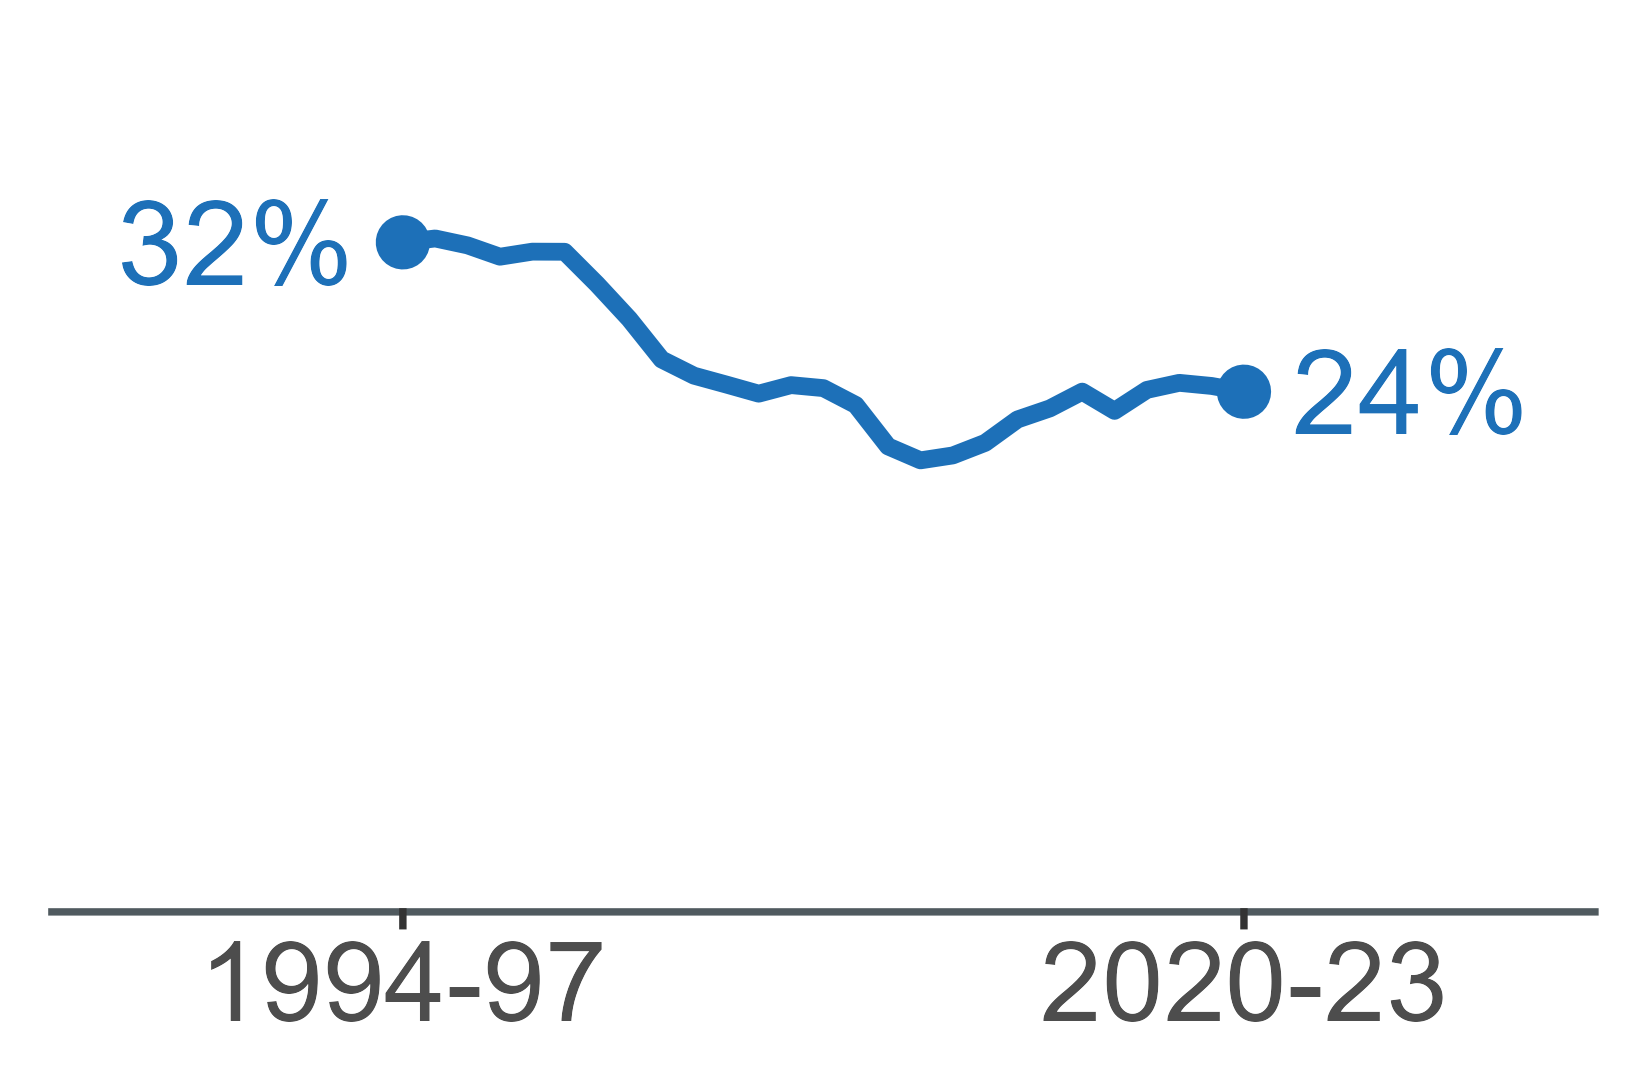
In 2017-20, the Gini coefficient (before housing costs) was 32%. The Gini coefficient is usually calculated from income before housing costs, but we have included it for after housing costs income as well. After-housing-costs incomes are distributed more unequally.
Income inequality has been fluctuating since the beginning of this data collection in the mid-nineties, and, after the most recent high point in 2015-18 is currently decreasing again.
Income
Income trends
In 2017-20, median household income before housing costs was £533 per week. Median income has increased slowly but steadily since the recovery after the last recession, and has reached its highest level since reporting began.
Following the same trend, median income after housing costs was £481 per week in 2017-20, also at its highest level since reporting began.
Median incomes rose for all age groups between 2019/20 and the previous year: children, working-age adults and pensioners, but most for working-age adults. This data can be found in the associated tables. In the three-year averaged data shown here, the effect of the large increase in the latest year is much reduced by falling working-age income in the two previous years.
Figure 30 shows inflation-adjusted weekly equivalised incomes before housing costs across the different income deciles for the last four years, using individual years of data. From year to year, the decile points fluctuate slightly, partly because of actual fluctuations in the income distribution, and partly due to the particular survey samples in each year.
Deciles (or decile points) are the income values which divide the Scottish population, when ranked by income, into ten equal-sized groups. Decile is also often used as a shorthand term for decile group; for example 'the bottom decile' is used to describe the bottom ten percent of the population.
Figure 31 shows how the income decile points changed during the latest three-year period, between 2016/17 and 2019/20. Lower and middle decile points saw the largest increases, with almost no change in decile point 8, and decreasing incomes at the top and bottom decile points.
After-housing-costs data is available in the associated tables.
Income distribution
Figure 32 shows the distribution of weekly income before housing costs across Scotland in 2017-20 with relative poverty threshold, UK median income, and Scottish income decile groups. Incomes of £0 and below and those above £1,400 are excluded from this chart.
Many people have household incomes near the poverty threshold. This means that small movements in the overall distribution can sometimes lead to sizeable movements in poverty rates.
Decile groups are groups of the population defined by the decile points. The first decile group is the ten percent of the population with the lowest incomes. The second decile group contains individuals with incomes above the lowest decile point but below the second decile point.
Poverty thresholds
Most of the income estimates in this publication are based on equivalised income. This means that household income is adjusted to reflect different household sizes and compositions. When income is not equivalised, households of different sizes have different poverty thresholds. The table below shows the relative and absolute poverty thresholds, before equivalisation, for households of different sizes.
The incomes presented elsewhere in this report use the value for “Couple with no children” as the standard; incomes of all other household types are adjusted (equivalised) to reflect their different household composition.
| Before housing costs incomes | weekly | annual | weekly | annual | weekly | annual | weekly | annual |
|---|---|---|---|---|---|---|---|---|
| UK median income | £357 | £18,600 | £533 | £27,800 | £640 | £33,300 | £816 | £42,500 |
| Scottish median income | £357 | £18,600 | £533 | £27,800 | £640 | £33,400 | £816 | £42,500 |
| Relative poverty threshold (60% of UK median income) | £214 | £11,200 | £320 | £16,700 | £384 | £20,000 | £489 | £25,500 |
| Absolute poverty threshold (60% of inflation-adjusted 2010/11 UK median income) | £197 | £10,300 | £294 | £15,400 | £353 | £18,400 | £450 | £23,500 |
| Source: Family Resources Survey | ||||||||
An after-housing-costs table is available in the associated tables.
Income sources
Figure 33 shows the different sources of gross income by decile, ranking the population by income and dividing it into ten equal-sized groups. Income components are considered before tax; this is therefore a different definition of household income from that used elsewhere in this report.
Higher income households receive a large proportion of their income from earnings, and lower income households receive more of their income from social security payments. Social security payments include the state pension.
Earnings account for less than half of gross income for those in the first three deciles compared to over 80% for those in the top three deciles.
Except for the people in the second income decile, earnings are the main income source.
Data source
All the figures in this publication come from the Department for Work and Pensions’ (DWP) Households Below Average Income dataset, which is produced from the Family Resources Survey (FRS). UK figures are published by DWP in Households Below Average Income on the same day as Poverty and Income Inequality in Scotland. For the UK figures, as well as more detail about the way these figures are collected and calculated, see the DWP website.
What does HBAI measure?
Households Below Average Income (HBAI) uses household disposable incomes, adjusted for the household size and composition, as a proxy for material living standards. More precisely, it is a proxy for the level of consumption of goods and services that people could attain given the disposable income of the household in which they live.
The unit of analysis is the individual, so the populations and percentages in the tables are numbers and percentages of individuals - both adults and children.
Data is collected during the financial year, so between April and March of the following year. Statistics are usually published in March, a year after the end of the data collection.
The living standards of an individual depend not only on his or her own income, but also on the income of others in the household. Consequently, the analyses are based on total household income: the equivalised income of a household is taken to represent the income level of every individual in the household. Equivalisation, a technique that allows comparison of incomes between households of different sizes and compositions, is explained in the Definitions section. Thus, all members of any one household will appear at the same point in the income distribution.
Revision of the data
In 2021, previously published datasets underwent a minor methodological revision to capture all income from child maintenance. This led to small changes in household income and small adjustments to some poverty estimates. Therefore, some poverty and income estimates that were published in 2021 may not exactly match previously published estimates for 1994/95 to 2019/20. The revision did not affect any trends in poverty or household income.
Population coverage
The Family Resources Survey is a survey of private households. This means that people in residential institutions, such as nursing homes, barracks, prisons or university halls of residence, and also homeless people are excluded from the scope of the analysis presented here. The area of Scotland north of the Caledonian Canal was included in the FRS for the first time in the 2001/02 survey year, and from the 2002/03 survey year, the FRS was extended to include a 100 percent boost of the Scottish sample. This has increased the sample size available for analysis at the Scottish level. In 2002/03, the sample size was around five thousand. However, following cost savings introduced to the FRS in 2010, the sample size in Scotland has reduced. It was just over 2,800 households in 2019/20. For further information see the DWP Households Below Average Income publication.
Reliability of estimates
The figures are estimates based on sample surveys and are therefore subject to sampling variation. Caution should be exercised in the interpretation of small year-on-year fluctuations. Identification of trends should be based on data for several years. Estimates for the confidence intervals around the key figures presented are available.
The method used to calculate these confidence intervals changed in 2015/16. Information on this can be found in DWP’s statistical notice (pdf). The new method widens confidence intervals for most estimates making statistically significant results less likely than before.
The Family Resources Survey publication contains information on topics such as sample design, non-response biases, weighting; item non-response, imputation and editing; accuracy of income data.
Detailed methodology
More detailed information on definitions and methodology can be found on the Scottish Government’s poverty methodology pages and in DWP’s Households Below Average Income publication.
Housing costs
It could be argued that the costs of housing faced by different households at a given time do not always match the true value of the housing that they actually enjoy, and that housing costs should therefore be deducted from any definition of disposable income. However, any measure of income defined in this way would understate the relative standard of living of those individuals who were actually benefiting from a better quality of housing by paying more for better accommodation. Income growth over time would also understate improvements in living standards where higher costs reflected improvements in the quality of housing.
Conversely, any income measure which does not deduct housing costs may overstate the living standards of individuals whose housing costs are high relative to the quality of their accommodation. Growth over time in income before housing costs could also overstate improvements in living standards for low income groups in receipt of housing benefit, and whose rents have risen in real terms. This is because housing benefit may also rise to offset the higher rents (for a given quality of accommodation) and would be counted as an income rise, although there would be no associated increase in the standard of living.
Therefore, this publication presents analyses on two bases: before housing costs (BHC) and after housing costs (AHC).
Definitions
Household income
The income measure used in HBAI is weekly net (disposable) equivalised household income. This comprises total income from all sources of all household members including dependants. An adjustment is made to sample cases at the top of the income distribution to correct for volatility in the highest incomes captured in the survey.
Income is adjusted for household size and composition by means of equivalence scales, which reflect the extent to which households of different size and composition require a different level of income to achieve the same standard of living. This adjusted income is referred to as equivalised income (see definition below for more information on equivalisation).
Income before housing costs (BHC) includes the following main components:
- net earnings
- profit or loss from self-employment (after income tax and National Insurance contributions)
- all UK and Scottish social security payments, including housing and council tax benefits, tax credits, and the state pension
- occupational and private pension income
- investment income
- maintenance payments
- top-up loans and parental contributions for students, educational grants and payments
- the cash value of certain forms of income in kind such as free school meals, free welfare milk and free school milk and free TV licences for the over 75s (where data is available)
Income is net of:
- income tax payments
- National Insurance contributions
- contributions to occupational, stakeholder and personal pension schemes
- council tax
- maintenance and child support payments made
- parental contributions to students living away from home
Income after housing costs (AHC) is derived by deducting a measure of housing costs from the above income measure.
Housing costs
Housing costs include the following: rent (gross of housing benefit); water rates; mortgage interest payments; structural insurance premiums; ground rent and service charges.
Income sources
The analysis on income sources is the only analysis in this report not using net income. This analysis is based on income before taxes from employment or self-employment, social security payments, investment, occupational pensions and other income. In some cases, income from self-employment was negative in a year, for example, when someone in self-employment made a loss. In these cases, total income from earnings was set to zero. Negative investment income was also set to zero.
Real prices
Unless otherwise stated, all figures relating to income are in 2019/20 prices. Values from previous years are uprated to account for inflation using a variant of the Consumer Price Index (CPI). This follows a change in methodology for 2014/15. Prior to this the Retail Price Index (RPI) was used.
Full details can be found at this link: Methodological changes to poverty statistics (pdf)
Equivalisation
Equivalisation is the process by which household income is adjusted to take into account variations in the size and composition of the households in which individuals live. This reflects the common sense notion that, in order to enjoy a comparable standard of living, a household of, for example, three adults will need a higher income than a single person living alone. The process of adjusting income in this way is known as equivalisation and is needed in order to make sensible income comparisons between households.
Equivalence scales conventionally take an adult couple without children as the reference point, with an equivalence value of one. The process then increases relatively the income of single person households (since their incomes are divided by a value of less than one) and reduces relatively the incomes of households with three or more persons, which have an equivalence value of greater than one.
Consider a single person, a couple with no children, and a couple with two children aged fourteen and ten, all having unadjusted weekly household incomes of £200 (Before Housing Costs). The process of equivalisation, as conducted in HBAI, gives an equivalised income of £299 to the single person, £200 to the couple with no children, but only £131 to the couple with children.
The equivalence scales used here are the modified OECD scales. Two separate scales are used, one for income Before Housing Costs (BHC) and the companion scale for income After Housing Costs (AHC).
| Household member | BHC | AHC |
|---|---|---|
| First adult | 0.67 | 0.58 |
| Spouse | 0.33 | 0.42 |
| Subsequent adults | 0.33 | 0.42 |
| Children aged under 14 years | 0.20 | 0.20 |
| Children aged 14 years and over | 0.33 | 0.42 |
The construction of household equivalence values from these scales is quite straightforward. For example, the BHC equivalence value for a household containing a couple with a fourteen year old and a ten year old child together with one other adult would be 1.86 from the sum of the scale values:
0.67 + 0.33 + 0.33 + 0.33 + 0.20 = 1.86
This is made up of 0.67 for the first adult, 0.33 for their spouse, the other adult and the fourteen year old child and 0.20 for the ten year old child. The total income for the household would then be divided by 1.86 in order to arrive at the measure of equivalised household income used in HBAI analysis.
Further information on equivalisation can be found in the methodology report on the Scottish Government website.
Poverty measurement
Individuals are defined as being in poverty if their equivalised net disposable household income is below 60 percent of the UK median. The median is the income value which divides a population, when ranked by income, into two equal sized groups. Since the mean is influenced considerably by the highest incomes, median income thresholds are widely accepted as a better benchmark when considering a derived measure for poverty. Sixty percent of the median is the most commonly used poverty measure.
For a couple with no children, the UK median income before housing costs in 2017-20 was £533 per week, compared to £527 in the previous period. After housing costs, the UK median also increased from £473 in the previous period to £481 per week.
Consequently, the 60 percent poverty threshold, which is used to derive the low income household figures, has also increased in real terms, before and after housing costs. This means a household has to have a larger income in real terms to be above the poverty threshold.
Relative and absolute poverty
- Absolute poverty - individuals living in households whose equivalised income is below 60 percent of inflation-adjusted median income in 2010/11. This is a measure of whether those in the lowest income households are seeing their incomes rise in real terms.
- Relative poverty - individuals living in households whose equivalised income is below 60 percent of median income in the same year. This is a measure of whether those in the lowest income households are keeping pace with the growth of incomes in the economy as a whole.
Child material deprivation
A suite of questions designed to capture the material deprivation experienced by households with children has been included in the Family Resources Survey since 2004/05. Respondents are asked whether they have 21 goods and services, including child, adult and household items. The list of items was identified by independent academic analysis (pdf, McKay, S. and Collard, S. (2004)). Together, these questions form a discriminator between those households with children that are deprived and those that are not. If they do not have a good or service, they are asked whether this is because they do not want them or because they cannot afford them.
These questions are used as an additional way of measuring living standards for children and their households.
A prevalence weighted approach has been used, in combination with a relative low income threshold. The income threshold is 70 percent of the median income. Prevalence weighting is a technique of scoring deprivation in which more weight in the deprivation measure is given to households lacking those items that most in the population already have. This means a greater importance, when an item is lacked, is assigned to those items that are more commonly owned in the population.
Changes to measuring material deprivation in 2010/11
The 21 items in the suite of questions used to measure material deprivation are designed to reflect the items and activities people in the UK believe to be necessary. These items are reviewed periodically to ensure the measure remains a relative measure of poverty. In 2010/11, four new questions about additional items were included in the FRS to be used in the future calculation of material deprivation scores, replacing the four existing items that were identified by research as potentially out of date partly because the proportion of the population considering them necessary had fallen. As such, there is a break in the series for child low income/material deprivation and estimates from 2010/11 onwards cannot be compared to those from before 2010/11.
In the 2010/11 FRS, both the new and the old questions were asked. As such, single-year estimates are presented based on both sets of questions for this year.
For further information about material deprivation see the DWP Households Below Average Income publication.
Pensioner material deprivation
A suite of questions designed to capture the material deprivation experienced by pensioner households has been included in the Family Resources Survey since 2009/10. Respondents are asked whether they have access to 15 goods and services. The list of items was identified by independent academic analysis. See:
- Legard, R., Gray, M. and Blake, M. (2008), Cognitive testing: older people and the FRS material deprivation questions, Department for Work and Pensions Working Paper Number 55 (pdf)
- McKay, S. (2008), Measuring material deprivation among older people: Methodological study to revise the Family Resources Survey questions, Department for Work and Pensions Working Paper Number 54 (pdf)
Together, these questions form the best discriminator between those pensioner households that are deprived and those that are not.
Where they do not have a good or service, pensioner households are asked whether this is because they do not have the money for this, it is not a priority on their current income, their health / disability prevents them, it is too much trouble or tiring, they have no one to do this with or help them, it is not something they want, it is not relevant to them, or any other reason. Where a pensioner lacks one of the material deprivation items for one of the following reasons - they do not have the money for this, it is not a priority for them on their current income, their health / disability prevents them, it is too much trouble or tiring, they have no one to do this with or help them, or any other reason - they are counted as being deprived for that item.
The exception to this is for the question on whether they could cover an unexpected expense, where the follow up question was asked to explore how those who responded ‘yes’ would cover this cost. Options were: use own income but cut back on essentials, use own income but not need to cut back on essentials, use savings; use a form of credit, get money from friends or family, or any other reason. Pensioners are counted as materially deprived for this item if and only if they responded ‘no’ to the initial question.
The same prevalence weighted approach has been used to that for children, in determining a deprivation score. Prevalence weighting is a technique of scoring deprivation in which more weight in the deprivation measure is given to households lacking those items that most already have. This means a greater importance, when an item is lacked, is assigned to those items that are more commonly owned in the pensioner population.
For children, material deprivation is presented as an indicator in combination with a low income threshold. However for pensioners, the concept of material deprivation is broad and very different from low income; therefore, it is appropriate to present it as a separate measure.
A technical note giving a full explanation of the pensioner material deprivation measure is available for download.
Food security
The Family Resources Survey collected household food security information for the first time in 2019/20. The questions were adopted from the United States Department of Agriculture’s Adult Food Security Survey Module (pdf), using a 30-day reference period, and using the same food security levels (“high”, “marginal”, “low”, “very low”).
The food security analysis in this report excludes shared households, such as a house shared by a group of professionals. These respondents may not have insight into the food security status of others in their household and may not regularly share financial information.
Previously, data on household food insecurity in Scotland had been collected by the Scottish Health Survey. The measure in this report is different from the one from the Scottish Health Survey, because it is based on different questions, which are asked in a different context, using a different sample of the population, and refer to a different period of time. Therefore, these measures cannot be directly compared.
Dependent children
In this publication, ‘child’ refers to a dependent child. A dependent child is a person aged 0-15, or a person aged 16-19 and: not married nor in a Civil Partnership nor living with a partner, and living with their parents, and in full-time non-advanced education or in unwaged government training.
Single parents
Family types are becoming increasingly complex. In this publication, ‘single parents’ and ‘single mothers’ refer to a situation where the primary residence of a dependent child is in a household with one adult. Data for single fathers is not available due to small sample sizes. This household type does not necessarily imply that the child only has contact with one parent. The child may have non-resident parents who contribute to their welfare. Income transfers from a non-resident parent to the resident parent (such as Child Maintenance payments) are included in the household income.
Find more information
Tables and further analysis
This publication contains the headline poverty, child poverty and household income statistics. Associated tables are available for download and contain:
- all estimates used in the charts
- additional estimates, for example, the equivalent before-housing-costs estimates where charts show after-housing-costs estimates only (where available)
- additional relative and severe poverty and child poverty estimates including numbers, rates and compositions of those in poverty disaggregated by a wide range of personal and household characteristics
Additional analysis themes are based on the needs of users. If you have any suggestions for future analysis please contact us.
Local poverty analysis
The main poverty data source, the Family Resources Survey, provides information at national level only. Alternative data sources are not directly comparable with the official poverty estimates presented in this report.
More information on local poverty and income analysis from alternative data sources is available.
Persistent poverty
New figures on persistent poverty were published on 25 March 2021.
Persistent poverty identifies the number of individuals living in relative poverty for 3 or more of the last 4 years. It therefore identifies people who have been living in poverty for a significant period of time, the rationale being that this is more damaging than brief periods spent with a low income, with the impacts affecting an individual through their lifetime.
One of the four statutory child poverty target measures is persistent child poverty after housing costs.
These figures come from the Understanding Society survey which tracks individuals over time. The persistent poverty figures are not directly comparable to the figures in this publication as they use different income definitions and cover different time periods, but they provide useful additional information on poverty in Scotland.
Previous reports
Poverty and Income Inequality in Scotland
Persistent Poverty in Scotland
Scottish Government websites
Further analysis based on the FRS and HBAI datasets is published by the Scottish Government throughout the year on the Scottish Government’s poverty and child poverty statistics webpages. These and other Scottish Government statistics are available here:
National Statistics
Official and National Statistics are produced to high professional standards set out in the Code of Practice for Official Statistics. Both undergo regular quality assurance reviews to ensure that they meet customer needs and are produced free from any political interference.
Statistics assessed, or subject to assessment, by the UK Statistics Authority carry the National Statistics label, a stamp of assurance that the statistics have been produced and explained to high standards and that they serve the public good.
The designation of these statistics as National Statistics was confirmed in May 2012 following a compliance check by the Office for Statistics Regulation.
Access source data
The data collected for this report cannot be made available by Scottish Government for further analysis, as the Scottish Government is not the data controller. However, the data controller (the UK Department for Work and Pensions) are making the data available through the UK Data Service.
Contact
For enquiries about this publication please contact the lead statistician.
Maike Waldmann
Communities Analysis Division
Address
The Scottish Government
Communities Analysis Division
Area 2H North
Victoria Quay
Edinburgh EH6 6QQ
Phone
0131 244 5851
If you would like to be consulted about statistical collections or receive notification of publications, please register your interest at ScotStat.
Details of forthcoming publications are regularly published.
Crown Copyright
You may use or re-use this information (not including logos) free of charge in any format or medium, under the terms of the Open Government Licence.